Investigation of DNA-Binding Properties of VqsM and Mutant Forms in P. aeruginosa
This study explores the DNA-binding characteristics of VqsM and various mutant forms, analyzing their interactions with DNA at different concentrations (μM). Figures S1 to S9 present key experimental data, including the impact of specific amino acid substitutions in lasI and the binding affinities of VqsM, ExoS, and ExoT over time. The results highlight the complex dynamics of protein-DNA interactions and the implications for understanding quorum sensing in Pseudomonas aeruginosa.

Investigation of DNA-Binding Properties of VqsM and Mutant Forms in P. aeruginosa
E N D
Presentation Transcript
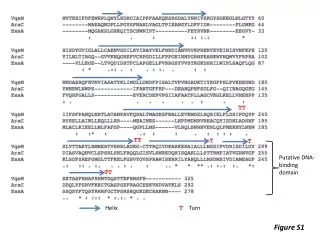
TT TT T T Putative DNA-binding domain TT Helix T Turn Figure S1
A KDa 100 72 55 40 33 24 17 VqsMt-6His (μM) B C 11 0.1 0.2 0.5 0.1 0.2 0.5 1.0 1.0 1 2 0 0 rhlI-p vqsR-p Figure S2
4 hr 12 hr 24 hr Figure S3
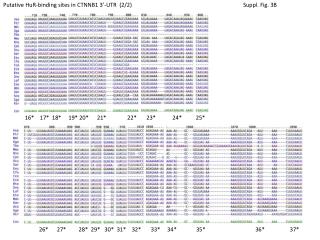
VqsMt-6His (μM) 0.1 0.2 0.5 1.0 0.1 0.2 0.5 1.0 0.1 0.2 0.5 1.0 0.1 0.2 0.5 1.0 0 0 0 0 Protein- DNA Free DNA lasI-P98A/G lasI-P97T/G lasI-P100T/C lasI-P99G/T Protein- DNA Free DNA lasI-P96C/A lasI-P95T/G lasI-P94T/C
VqsMt-6His (μM) 0.1 0.2 0.5 1.0 0.1 0.2 0.5 0.1 0.2 0.5 1.0 1.0 0 0.1 0.2 0.5 1.0 0 0 0.1 0.2 0.5 1.0 0 0 Protein- DNA Free DNA lasI-P93T/G lasI-P90G/T lasI-P91C/A lasI-P89G/A lasI-P92T/A Protein- DNA Free DNA Figure S4 lasI-P88A/T lasI-P87C/A lasI-P86G/A
A B D C
E F Figure S5
A B ∆vqsM/p-vqsM PAO1(∆vqsM) PAO1 C D ExoT ExoS 12 hr ExoT ExoS 24 hr Figure S6
A 1 2 3 4 B Figure S7
VqsMt -6His (μM) +C4 • VqsMt -6His (μM) 0.05 0.05 0.025 0.025 0.5 0.5 0.1 0.2 0.1 0.2 1.0 1.0 0 0 Protein-DNA lasI-p • VqsMt -6His (μM)+PQS • VqsMt -6His (μM)+C12 0.025 0.5 0.1 0.2 1.0 0.05 0.05 0.025 0.5 0.1 0.2 1.0 0 0 Protein-DNA lasI-p Figure S8
VqsM only VqsM+LasRLasR only A uM 0 0.5 1 2 0.5 1 2 0 0.5 1 2 Protein-DNA lasI-p VqsM only ExsA only VqsM+ExsA B .05 .1 .2 .4 .05 .1 .2 .4 uM 0 .05 .1 .2 .4 Protein-DNA lasI-p C VqsM only RsaL only VqsM+RsaL .05 .1 .2 .4 .05 .1 .2 .4 uM 0 .05 .1 .2 .4 Protein-DNA Figure S9 lasI-p