Download
1 / 11
110 likes | 289 Vues
CME observations using spectroscopy and polarimetry. Hui Tian, Scott W. McIntosh, Steven Tomczyk, Christian Bethge, Giuliana de Toma, Leonard Sitongia, Don Kolinski, et al. HINODE/EIS & CoMP observations. Spectroscopic observations of CMEs.

E N D
CME observations using spectroscopy and polarimetry Hui Tian, Scott W. McIntosh, Steven Tomczyk, Christian Bethge, Giuliana de Toma, Leonard Sitongia, Don Kolinski, et al. HINODE/EIS & CoMP observations
The background corona and CME ejecta can be separated through spectroscopic observations • Plasma properties (density, temperature) and real speed of CMEs (v=Sqrt(vpos2+vlos2)) can be derived • Mass of the ejecta can be estimated Tian, McIntosh et al. 2012, ApJ, 748, 106
CoMP: Coronal Multi-channel Polarimeter • Locations • Mauna Loa Solar Observatory: almost daily observations since October 2010 • Spectral sampling: • Fe XIII 1074.7/1079.8 nm and He I 1083.0 nm • Images of each polarization state at 3 or 5 spectral positions • FOV: 1.05 to 1.4 Rsun • Spatial Resolution: 4.46”/pixel • Cadence: typically 30 s or 50 s Tomczyk et al. 2008, Sol. Phys.
EUV waves produced by halo-CMEs • CoMP provides simultaneous high-cadence (30 s) observations of coronal line intensity, Doppler shift and line width for the first time. • Solar eruptions are associated with dramatic changes of Doppler shift and line width.
Density map of the corona and CME mass • Density: from ratio of Fe XIII 1074.7/1079.8 nm • Estimate CME mass • Calculate coronal magnetic field strength From CHIANTI 7.0 Preliminary results data correction not finalized
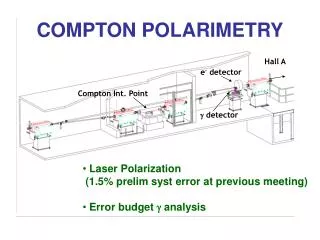
Stokes Q, U, V • Circular Polarization (V): LOS magnetic field strength from longitudinal Zeeman effect • Linear Polarization (Q,U) from resonance scattering effect • Degree of linear polarization (Ltot/I) • Azimuth of B (POS magnetic field direction) Ltot=(Q2+U2)1/2 ϕ=0.5 atan (U/Q)
Summary • Spectroscopic observations (HINODE/EIS, IRIS, et al.) can be helpful in studies of (especially halo-) CME plasma properties, LOS kinematics, development and recovery of dimmings. • Simultaneous observations of electron density, LOS Doppler shift, line width and linear/circular polarization by CoMP can be used to constrain models of CME initiation and propagation. • We need COSMO+ChroMag. Observations of halo-CMEs by ground-based instruments like COSMO and ChroMag provide a cheap and low-risk means of space weather monitoring. Posters 086 & 090
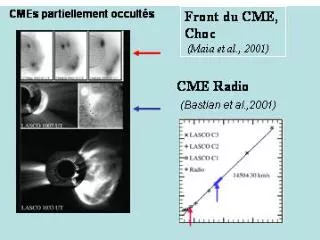
Dec 14-15 2006 CME May 19 2007 CME • A small portion of the plasma in the dimming region is flowing outward at a speed of ~100 km/s. These outflows could potentially play an important role in refilling of the corona, mass supply to the solar wind, and additional acceleration of CMEs • Spectroscopic observations can provide a measurement of the density change and thus can be used to estimate mass of CMEs, especially halo-CMEs (mass loss in dimming)