Enhancing Network Coverage Analysis with AAT Allocation and Impedance Data
This guide details how to prepare and allocate network coverage using AAT commands, specifically focusing on the ALLOCATE command that efficiently allocates demand along least-cost paths using link impedance and demand data. It explains how to use the ADDITEM command to integrate impedance items such as speed limits and turn times into the AAT structure, and how to calculate travel time and turn impedances, ensuring accurate network data for analysis and decision-making.

Enhancing Network Coverage Analysis with AAT Allocation and Impedance Data
E N D
Presentation Transcript
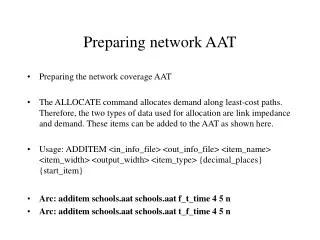
Preparing the network coverage AAT The ALLOCATE command allocates demand along least-cost paths. Therefore, the two types of data used for allocation are link impedance and demand. These items can be added to the AAT as shown here. Usage: ADDITEM <in_info_file> <out_info_file> <item_name> <item_width> <output_width> <item_type> {decimal_places} {start_item} Arc: additem schools.aat schools.aat f_t_time 4 5 n Arc: additem schools.aat schools.aat t_f_time 4 5 n Preparing network AAT
The from-to impedance item will be used if the link is to be traversed from the from-node to the to-node, that is, in the direction in which the arc was digitized. If the link being traversed is to be traversed in the opposite direction, the to-from impedance item is used. Use the ADDITEM command to add impedance items to the STREETS coverage AAT: Arc: usage additem Usage: ADDITEM <in_info_file> <out_info_file> <item_name> <item_width> <output_width> <item_type> {decimal_places} {start_item} Arc: additem streets.aat streets.aat from_to_imp 4 5 n Arc: additem streets.aat streets.aat to_from_imp 4 5 n From-to impedances
The values for speed limits stored in an AAT item named SPEED_LIMIT in the coverage STREETS will be used to calculate the travel time in minutes. The travel times will be the from-to and to-from impedances for the links of the network. Arcplot: usage calculate Usage: CALCULATE <cover> <feature_class> <target_item> = <arithmetic_expression> Arcplot: calc streets arc from_to_imp = ( 60 * ( length / 5280 ) ) / speed_limit FNODE# = 3 TNODE# = 4 LPOLY# = 1 RPOLY# = 4 LENGTH = 10000.00 STREETS# = 3 STREETS-ID = 2 SPEED_LIMIT = 35 FROM_TO_IMP = 3.25 TO_FROM_IMP = 3.25 The impedances in the FROM_TO_IMP and TO_FROM_IMP items in this sample AAT record have been calculated from attribute data in the SPEED_LIMIT item. Assigning link impedances
To model turns and assign turn impedances, a turntable or coverage TRN file must be created using the TURNTABLE command. A turntable for the STREETS coverage is created as shown here: Arc: usage turntable Usage: TURNTABLE <cover> {weed_tolerance} {selection_file} {UTURNS | NOUTURNS} Arc: turntable streets (This creates a turntable file named STREETS.TRN). A turn impedance item must be added to the TRN to assign impedance values: Arc: additem streets.trn streets.trn turn_imp 4 5 n 2 Creating a turn table
Left turns are estimated to have an impedance of 30 seconds (0.50 minutes) and right turns have impedances of 10 seconds (0.17 minutes). Values are assigned using the SETTURN command. Before using SETTURN, the network coverage must be specified using NETCOVER and the turn impedance item set with IMPEDANCE Arcplot: netcover streets path1 Arcplot: impedance # # turn_imp Now use SETTURN to assign impedances to right and left turns: Arcplot: usage setturn Usage: SETTURN <impedance> {* | direction} Arcplot: setturn .17 right Arcplot: setturn .50 left Assigning turn impedances
STREETS-ID IN_ORDER ROUTE_ID STOP_IMP TRANSFER 1 1 2 5.0 3 6 2 2 5.0 2 26 3 2 5.0 6 STOP_IMP = time/cost of stop TRANSFER = number of packages dropped off/picked up etc. Creation of a stops file
Assume a point coverage based on address matching Arc: usage frequencyUsage: FREQUENCY <in_info_file> <out_info_file> {case_item}FREQUENCY produces an INFO file that will contain the total number of occurrences of each network coverage arc in the students point coverage.Arc: frequency students.pat students.frqEnter Frequency item names (type END or a blank line when done):=============================================================Enter the 1st item: schools-idEnter the 2nd item: endEnter Summary item names (type END or a blank line when done):=============================================================Enter the 1st item: END Determining how many students live on a street
Arc: list students.frqRecord CASE# FREQUENCY SCHOOLS-ID 1 1 2 37477 2 2 1 41999 3 3 1 42384 4 4 1 42644 5 5 1 42875 6 6 10 43079 7 7 8 43228This is a sample of the INFO file created with FREQUENCY. It shows that two students live on the arc whose ID is 37477, 1 student on arc ID 41999, and so on.JOINITEM is used to add this data to the coverage AAT.Usage: JOINITEM <in_info_file> <join_info_file> <out_info_file> <relate_item> <start_item> {LINEAR | ORDERED | LINK}Arc: joinitem schools.aat students.frq schools.aat schools-id t_f_time linear Allocating students to arcs
The estimated time required to traverse an arc (that is, walk one block) is computed by dividing the arc length in miles by the estimated walking speed in miles per hour and multiplying by 60. In this example, the calculation is done in INFO:ENTER COMMAND > select schools.aat37 RECORD(S) SELECTEDENTER COMMAND > calculate f_t_time = (60 * ( length / 5280 ) ) / 1.5The to-from impedance is computed to be the same as the from-to:ENTER COMMAND > calculate t_f_time = f_t_timeThe SCHOOLS coverage is now prepared for allocation analysis. Computing impedances - eg. walking time
FNODE# = 18 TNODE# = 17 LPOLY# = 8 RPOLY# = 1 LENGTH = 342.000 SCHOOLS# = 17 SCHOOLS-ID = 215 CLASS = 2 ADDRESS = 301 399 300 398 SAN BERDOO AV W F_T_TIME = 3.5 T_F_TIME = 3.5 STUDENTS = 10 Example of AAT
The centers file must contain a cover-ID item to store the node ID where the center is located. Additional items: output route IDs, maximum impedance, center supply, maximum impedance allocated and total demand allocated. The last two of these items are written by ALLOCATE, and will be created by ALLOCATE if they do not already exist. This is an example of a centers file. The SCHOOLS-ID item is the node ID where the schools are located. SCHOOLS-ID ROUTE_ID MAX_TIME SEATS 960 1 30.00 30 285 2 30.00 60 76 3 30.00 90 Create center’s file
Arcplot: usage allocate Usage: ALLOCATE {CENTERS} {OUT | IN}{CONNECTED | UNCONSTRAINED} {ARC | {NODE | BOTH {<node_allocfile>{NONZERO | ALL}}}} Usage: ALLOCATE * {maximum_impedance} {capacity} {OUT | IN} {CONNECTED | UNCONSTRAINED} {ARC | {NODE | BOTH {<node_allocfile> {NONZERO | ALL}}}} Usage: ALLOCATE <node_id...node_id> {END {maximum_impedance} {capacity}} {OUT | IN} {CONNECTED | UNCONSTRAINED} {ARC | {NODE | BOT {<node_allocfile>{NONZERO | ALL}}}} Arcplot: allocate centers out Running allocate