Download
1 / 32
340 likes | 468 Vues
Join us for an informative webinar presented by the U.S. Department of Energy's Office of Indian Energy. This session will explore energy planning, development, and efficient use of renewable resources on tribal lands, emphasizing the importance of electrification, infrastructure improvements, and energy cost management. We will discuss the Western Area Power Administration's role in marketing renewable electricity, the intricacies of the North American grid interconnections, and critical concepts such as balancing authority, power capacity, and real-time load management.

E N D
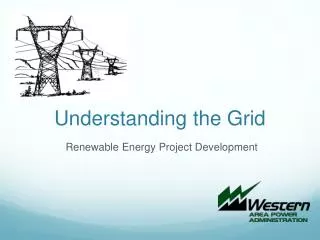
Understanding the Grid Renewable Energy Project Development
WEBINAR SPONSORS • The U.S. Department of Energy (DOE) Office of Indian Energy Policy & Programs is responsible for assisting Tribes with energy planning and development, infrastructure, energy costs, and electrification of Indian lands and homes. • The Tribal Energy Program, under the DOE’s Office of Energy Efficiency and Renewable Energy Weatherization and Intergovernmental Program, promotes tribal energy sufficiency, and fosters economic development and employment on tribal lands through the use of renewable energy and energy efficiency technologies. • Western Area Power Administration is one of four power marketing administrations within the DOE whose role is to market and transmit renewable electricity from multi-use Federal water projects over 17,000 miles of transmission line.
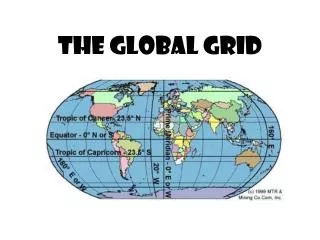
Major Transmission Lines in the West There are three “Interconnections” in the North American Grid: Eastern Grid, Western Grid, and Texas. These all operate at 60 Hz but they are not synchronized. Any crossing between must be brought to Direct Current (DC)and then back to Alternating Current (AC). This transition is limited by equipment at the boundaries and is a congestion boundary as well. The same is true into Mexico except Baja which is part of the Western electric Coordinating Council and is synchronized. Canada is split along the same lines as the United States between east and west.
Electricity Transmission System • Transmission • Voltage Levels • Transmission • 230 kilovolt (kV) • 345 kV • 500 kV • 765 kV • 1,000 kV and above • Sub-transmission • 69 kV • 115 kV • 138 kV 69 kV 230 kV 345 kV Source: http://www.osha.gov/SLTC/etools/electric_power/illustrated_glossary/transmission_lines.html
Power (MW) vs. Energy (MWh) Power Capacity Peak Demand Energy Area Under the Curve Source: California ISO (http://www.caiso.com/Pages/TodaysOutlook.aspx)
Balancing Authority, Frequencyand Area Control Error • Generation must match Loads in real time • Each BA works to minimize Area Control Error within WECC/ NERC boundaries • System operates at 60 Hz • If frequency goes below 60 Hz this causes a drop in the system voltage resulting in an area control error • Spinning Generators have Automatic Generation Control to return the frequency to 60 Hz and therefore restore the system frequency • Operators can then correct the area control error. The Operators in each BA schedule and compare energy crossing the boundaries with their neighboring BAs each 15 minutes to assure transfers and keeping whole themselves and the neighbors BAs.
Ancillaries • Volt Amp Reactive (VARs) • Reserves • Spinning • Standby • Regulation • Losses Current Squared times Resistance of the line
Spinning Reserve Failure Unexcited Spin Each generator must cover the loss of its own power. This can be done in one of two ways. Self provide by having other generation at its disposal – either purchased or owned. Be part of a reserve sharing group. This reduces the amount of reserves that each member must provide and allows the group to cover the loss of its single largest hazard such as loss of a generator unit, transformer, or interconnection line. Demand Side Management may also be used if approved by the Regulating Authority Balancing Authority must assure this is covered. All must be within a Balancing Authority. Load Load IPP
Standby Reserve Failure Unexcited Spin Must be available before the end of the hour. Must cover loss of single largest hazard such as loss of a generator unit or transformer or interconnection line that causes loss of generation. If not in a reserve sharing group an IPP or utility generation must cover their own hazard to the grid. Arrangements for activation of the Standby resource must be in place and transmission to get it to Hub/Load. Demand Side Management may be used if approved by the Regulating Authority. (Dumping Loads) Balancing Authority must assure this is covered. All must be in a Balancing Authority. Load Load IPP
Regulation AGC Regulation is simply the adjustment of generation to match load, both increases and decreases. While a spinning generator with frequency control has Automatic Generation Control to bring it back to 60 Hz; it also has control from the control center to ramp it up and down to match loads information at the Dispatch control Regulation is to assure that generation matches load in seconds and endeavors to anticipate the Area Control Error situation. Generation that has no control and has a Capacity Factor of less than 100% requires more Regulation Reserves and Imbalance Energy. Load
Losses T / From Neighboring BA Unexcited Spin Losses are a function of the routing of Current through the lines, transformers, and other transmission equipment. It is Current squared times Resistance. Within a closed system it can be developed by taking the resources into the BA minus the resources out of the BA, plus the Resources and minus Loads contained in the BA as a closed system. Whatever was not accounted for is losses. Most transmission systems provide a systems loss number which is charged financially by the MWh for generation to counter the loss. In most systems this number is 2 to 4 percent of the scheduled transmission. As one goes from system to system these numbers add. In RTOs these numbers are developed based on a business practice. Load Load IPP
Major Differences betweenTransmission and Distribution Systems • Size, scale, and Capacity • Operation is fundamentally different • Transmission system is operated actively to move large amounts of power • Distribution system is operated passively to serve local load Medium Distribution Voltage levels 4.16 kV 6.9 kV 13.2 kV 25 kV 34.5 kV 46 kV Low Distribution Voltage levels 480 volt (V) 120/240 V (single-phase) Photo by Mike Coddington, NREL
Transmission Line Capacities(line capacities vary depending on type/size of conductor used and other factors)
Loop Flow example: 100MW scheduled from Wyoming to Southern California over northern path will flow on southern path as well WA, OR, No CA Wyoming, Montana, Colorado • So CA, AZ, So NV Four Corners, Northern AZ
example: If 100MW scheduled from circle to triangle, more power will flow on Low IMPEDANCE LINE Parallel Flow High Impedance line/path Low Impedance line/path
Excess Capacity • Reverse Direction • Use of the overbuild • Situational Overloading • Contracted but not used in Real Time (Hourly Scheduling, or shorter) • Situational Unloading
Excess Capacity • Total Transfer Capability • Available Transfer Capability. • Power Flow Studies • Seasonal loading • Loads • Generation Location • Weather and Sag Line Ratings • North American Electric Reliability Corporation (NERC) rules
Purchase ofTransmission Service (TSR) • Series of Toll Roads from Generation to Load injection point of the LSE (Pancaking) • In an Regional Transmission Operator the Tolls are lumped to a single rate and you pay for RTO fees and new lines are rolled into the postage stamp cost. • TSRs aren’t usually needed for a Net Metering Agreement involving your own use of generation you produce.
Highway Analogy • Be careful this is not a match; remember VARs, ACE, losses, regulation, reserves? • Interstates <> 230 kV and above • Local Roadways <> Higher impedance 100 kV and Below • What is impedance anyway? • What if the highway is full (congestion). • Directionality of electricity (Displacement, electrons seek the closest load based on impedance and phase. How high can I stack this?
How can I get onto the highway? • Each Transmission Provider has an Open Access Transmission Tariff (OATT) • This is called “Interconnection” and depends on your Generator size. • Less than 20 MW is called Small Generator Interconnection Procedures (SGIP) • Greater than 20 MW is called Large Generator Interconnection Procedures (LGIP) • Load Serving Entity (LSE) Procedures for Net Metering (This assumes that you are not selling to an entity other than your LSE.) • Interconnection also depends on your impact on the Network (aka. Grid). You cannot be denied but you will be told what it costs.
Is Pancaking Bad? • If transmission rates are based on cost and regulated to be a low as possible then the sum of pancakes is what the infrastructure requires to remain functional. • If operations costs are higher for combining the systems then perhaps Pancaking is good. • It is an issue every day and debated hotly.
Reason transmission Rates Differ • Pancakes are different prices • Long lines can cost billions of Dollars • Lines through rough terrain cost more. • In a joint owned line the cost can vary based on what companies rights are being used. • Newer lines have not “Paid Off” • Lines owned by Investor Owned Utilities must pay stockholders. FERC allows certain Return on Equity. • Development cost for a long line can be very large due to environmental processes, California is particularly difficult and National Environmental Policy Act (NEPA) plays when federal lands or entities are involved.
Generator Types • Utility generator for its own loads • Independent Power Producer • Captured Independent Power Producer • Power Purchase Agreement (PPA) with the LSE for entire output and control of output. • IPP for delivery to the “Market” • IPP for delivery to the Imbalance Market
Load Types • Load Serving Entity • Serves a region, is the provider of last resort, and is responsible to Customers for distribution grid reliability and continuity of service. • Self Service • Off the grid, provides own reliability • Partial Self Service • Connected to grid for reliability and when own service is not adequate. • Net Metering • Generates more than needed at times, which the LSE purchases at wholesale rates or holds for return when needed. This is usually referred to as an energy efficiency effort. • Ancillaries for TSR and Imbalance
Marketing your Energy • Self Providing (Sometimes called Distributed Generation (DG) or Energy Efficiency (EE) • May contain Net Metering with the LSE • May be Off the Grid • Should consider what happens if the generator quits • LSEs are becoming aware that these uses reduce their energy sales commodity supporting the infrastructure. Soon they will be charging Customers for infrastructure based on capacity requirements.
Marketing your Energy • Your generator must be large enough to assure payment of development and financing costs in a reasonable time (5 to 7 years) along with the Operations and Maintenance costs. • A larger generator requires a larger Capacity interconnection and transmission facility. • A larger generator has more impact on the Grid interconnection point and systems.
Marketing Your Energy • Selling your energy into the “market” requires price competitiveness. • Obtaining a Power Purchase agreement with an LSE to fulfill their regulatory Renewable Portfolio Standard provides the best alternative. • LSEs generally do this via an Request for Proposal (RFP) • The greater the reliability (read Capacity Factor) and controllability the more the resource is desirable. • The greater your price competitiveness the more your resource is desirable. • Partner with a gas fired generator to enable firmness of your resource and extension of your Renewable Energy Credits.
Timing • It takes 2 to 4 years to develop a project, Currently down payments are $250,000 for most line owner’s interconnection processes and Clustering is the norm. • Current Federal Tax Credits (It takes longer to develop a project than considered in the tax rules; thus development is done with risk capital.) • Renewable Portfolio Standards continue to change both up and down. • Some states “desire” that energy is generated in the state for the state LSEs. • Look for the LSE RFPs after doing your homework.
Pricing • Many studies are based on Locational Marginal Price (LMP). Since these do not consider price of capital and development costs these should be viewed for what they actually state. • CAISO purchases generation based on bids and LMP. • LMP doesn’t include all costs. • Consider the following costs for the project: environmental studies, Interconnection studies, Engineering the interconnection, dealing with financial institutions, Cost of capital, land accusations, construction costs, and strategic positioning, Operations and Maintenance, the cost of RTOs, and NERC compliance. • Then consider the cost per MWh you are marketing with production cost, delivery cost, losses, Ancillaries, and scheduling.
Reality Coefficient (RC) • While not listed in the RFP your RC will be considered. The process of an RFP is costly to the LSE and awarding to a company that cannot deliver is not desirable. You must be able to demonstrate reality with land acquisition, environmental completion, and financial backing to the completion of the job.
Policy: Regulatory Bodies for the Electricity Grid • Federal Energy Regulatory Commission (FERC) • North American Electric Reliability Corporation (NERC) • Regional Reliability Councils • Utility commissions and districts regulate privately and publicly owned electricity providers • Utilities Commission • Utility Regulatory Commission • Public Utilities Commission • Public Service Commission (may be civil service oversight body rather than utility regulator) • Public Utility District (tribal, state, or government owned utility, consumer owned and operated, small investor owned) • Publicly owned utilities include cooperative and municipal utilities • Cooperative utilities are owned by the customers they serve (farmers and rural communities) • Regional Transmission Operators / Independent System Operators