Download
1 / 36
360 likes | 545 Vues
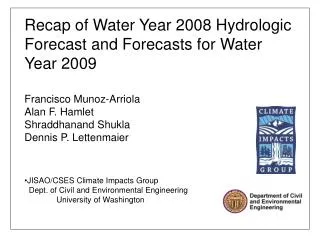
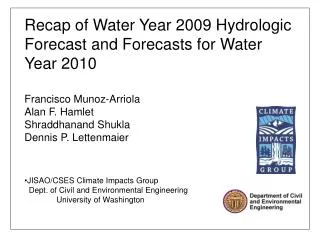
Recap of Water Year 2009 Hydrologic Forecast and Forecasts for Water Year 2010. Francisco Munoz-Arriola Alan F. Hamlet Shraddhanand Shukla Dennis P. Lettenmaier JISAO/CSES Climate Impacts Group Dept. of Civil and Environmental Engineering University of Washington. Outline.

E N D
Recap of Water Year 2009 Hydrologic Forecast and Forecasts for Water Year 2010 • Francisco Munoz-Arriola • Alan F. Hamlet • Shraddhanand Shukla • Dennis P. Lettenmaier • JISAO/CSES Climate Impacts Group • Dept. of Civil and Environmental Engineering • University of Washington
Outline • The UW West-wide Seasonal Hydrological Forecast System • Hydrology Model • Ensemble Streamflow Prediction (ESP) • Recap of Water Year 2009 • ENSO conditions and 2008 Streamflow forecast reliability • Water year 2010 • Warm ENSO “El Niño Travieso” or the Mischievous Boy • Land-surface conditions: Soil Moisture (SM) and Surface Water Equivalent (SWE) • UW-West-wide Seasonal Hydrological Forecast System: Forecasting 2010 streamflow • Summary
VIC Snowpack State Soil Moisture State
soil moisture snowpack streamflow, soil moisture, snow water equivalent, runoff local scale (1/8 degree) weather inputs INITIAL STATE VIC Hydrologic model spin up Hydrologic forecast simulation NCDC COOP station obs. up to 3 months from current index stn. real-time met. forcings for spin-up gap ensemble forecasts ESP traces CPC-based outlook NCEP CFS ensemble NSIPP-1 ensemble Observed SWE Assimilation SNOTELUpdate 25th Day, Month 0 1-2 years back Month 12 UW West-wide Seasonal Hydrologic Forecast System
Applications: climate forecast Ensemble Streamflow Prediction (ESP) recent met data to generate “perfect” ICs ensemble of historical met data to generate ensemble forecast Spin-up ICs Forecast observed hydrologic state
Simulated Streamflow Historical Streamflow (simulated) 1-yr Streamflow forecast (ESP) […] 1-yr 2005 1915 1960 1999
ECMRWF ENSO anomaly 2009 Predicted Neutral (N) 0.2 -0.6 Observed La Niña (LN) -1.0 European Centre for Medium-Range Weather Forecasts http://www.ecmwf.int/products/forecasts/d/charts/seasonal/forecast/seasonal_range_forecast/nino_plumes_public_s3/
Soil Moisture and Snow (SWE) Evolution WY 2009 Jan 1st Apr 1st Jul 1st Oct 1st
Ensemble Mean 1961-99 Historical Mean 1961-2000 Ensemble Members Observed Extremes Validation Plot for 2008 Forecast (1961-2000) at MILNE for predicted Neutral 3.4 Range 2009 -0.6 to 0.2 Ensemble Mean N years Observations WY 2009
Ensemble Mean 1961-99 Historical Mean 1961-2000 Ensemble Members Observed Extremes Validation Plot for 2008 Forecast (1961-2000) at MILNE based on the observed LN 3.4 in 2009 ~ -1 Ensemble Mean LN years Observations WY 2009
ENSO Transition States WY 2008 WY 2009 WY 2010 European Centre for Medium-Range Weather Forecasts http://www.ecmwf.int/products/forecasts/d/charts/seasonal/forecast/seasonal_range_forecast/nino_plumes_public_s3/
ECMRWF ENSO anomaly 2010 1.8 0.9 Forecast of September 2009 European Centre for Medium-Range Weather Forecasts http://www.ecmwf.int/products/forecasts/d/charts/seasonal/forecast/seasonal_range_forecast/nino_plumes_public_s3/
April-September Naturalized Flow for the Columbia River at The MILNE, ID from Historic Water Years vs January Nino 3.4 Anomalies. 1915-2005
The Mischievous Boy or “El Niño Travieso” visits the PNW NOAA, CFS Precipitation Forecast IRI-Multi-model Probability Precipitation Forecast Oct-Nov-Dec Dec-Jan-Feb
Historical Mean 1915-2000 Ensemble Members Observed Extremes Historical Streamflows (1915-2000) All Years Ensemble Mean EN years
Initial Conditions (changes in weeks) Sept 1st Sept 25th Oct 11th SM SWE
Ensemble Mean 1961-2000 Historical Mean 1961-2000 Ensemble Members Observed Extremes Streamflow Forecast on MILNE 1961-2000 All Years
Ensemble Mean 1961-99 Historical Mean 1961-2000 Ensemble Members Observed Extremes Based on MILNE Climatology 1961-1999 ESPs 3.4 Range 2010 0.9 to 1.8 Ensemble Mean EN years
Forecast and Observed Streamflow Differences MILNE 6 months 12 months EN ensemble mean - Observed Average (%)
Streamflow Forecast http://www.hydro.washington.edu/forecast/westwide/sflow/index.shtml
Summary • Expected Neutral ENSO conditions at the beginning for the WY 2009 showed good agreement with respect to observed streamflows (simulated) during the Fall-Winter seasons; for streamflow forecast during Sumer of 2009 forecast streamflow was underestimated • Recent increments in SM over parts of the Snake River Basin have improved the expected streamflows for WY 2010. However, a conspicuous warm phase of ENSO (EN) increase the likelihood of below normal streamflows over the SRB. • Stations along the mid- and upper SRB showed streamflows 8 to 12% (in average) below historical averaged streamflows for the following 6 months
2008 January June January June 2009 SWE SM
Soil Moisture and Snow Water Anomalies Sep 2009 Oct 2008 Jan 2009 Jun 2009
SWE and SM February March April Simulated Climatological
Simulated Streamflow from Observations ESP 1960 1999 2005 1915
SWE and SM for the 2008 and 2009 WY 2008 Simulated SWE SM Climatological 2009
Ensemble Mean 1961-99 Observed Mean 1961-2000 Ensemble Members Observed Extremes Based on MILNE Simulated Observations 1915-2005 All Years Ensemble Mean N years Observations WY 2009
UW Forecast System • Less than 10% of the stations are around the Climatology the rest are below at the North of Columbia river basin • Around 50% of the stations at the eastern portion of the basin with Stremflows around the climatology • In the stations related with hydropower generation at 81% ofthe normal • Dalles at 88% of the normal