Download
1 / 18
190 likes | 379 Vues
USE AND MISUSE OF STATISTICS. Algebra/Data Analysis HSA Objectives. 1. Students will be able to make informed decisions and predictions based on data from the results of simulations and from research. 2. Students will discuss the use and misuse of statistics.

E N D
Algebra/Data Analysis HSA Objectives 1. Students will be able to make informed decisions and predictions based on data from the results of simulations and from research. 2. Students will discuss the use and misuse of statistics
We use data collected from simulations and from research to make predictions. • If information is collected from a small UNBIASED sample, then proportions are used to draw conclusions about a larger sample or the entire population.
Example 1 A quality control engineer tested 800 video game cartridges and found 3 defective cartridges. The company plans to produce 500,000 video game cartridges this year. Based on the findings, how many video game cartridges can be expected to be defective? x = 1875
Example 2 In a random survey of 100 students at East High School, 58 said that they would like school to start one hour earlier. There are 1200 students at East High School. Based on the survey, how many students would you expect to favor starting school one hour earlier? A. 42 B. 58 C. 504 D. 696
Example 2 In a random survey of 100 students at East High School, 58 said that they would like school to start one hour earlier. There are 1200 students at East High School. Based on the survey, how many students would you predict to favor starting school one hour earlier? A. 42 B. 58 C. 504 D. 696
Example 3 • In a small town, 250 randomly sampled registered voters were asked whether they would vote “Yes” or “No” on Measure A in the next local election. This table shows the results. VOTER SURVEY RESULTS 5,500 people are expected to vote in the next election. Based on the data, how many people will vote “No” on measure A? A 96 B 130 C 2112 D 5280
Example 3 • In a small town, 250 randomly sampled registered voters were asked whether they would vote “Yes” or “No” on Measure A in the next local election. The table below shows the results. VOTER SURVEY RESULTS 5,500 people are expected to vote in the next election. Based on the data, how many people will vote “No” on measure A? A 96 B 130 C 2112 D 5280
Example 4 A class used a simulation to predict the genders of two babies. In the simulation, they tossed coins with heads (H) representing a male and tails (T) representing a female. The results of the simulation are shown below. TH HH TT TH HT TH TH TH HT TT HT TT TH HT HT HH HT TH HT TT Based on the simulation, what is the probability that both babies will be the same gender? A 25% B 30% C 40% D 50%
Example 4 A class used a simulation to predict the genders of two babies. In the simulation, they tossed coins with heads (H) representing a male and tails (T) representing a female. The results of the simulation are shown below. TH HH TT TH HT TH TH TH HT TT HT TT TH HT HT HH HT TH HT TT Based on the simulation, what is the probability that both babies will be the same gender? A 25% B 30% C 40% D 50%
Example 5 A basketball player expects that she has an 60% chance of scoring each time that she attempts a free throw. She wants to know the probability of scoring on one out of two consecutive free throw attempts. She uses a random number generator to conduct a simulation, where the digits 0 through 5 represent a successful free throw. Her simulation results for 10 trials are shown below. 21 64 79 85 48 17 72 96 00 74 Based on her simulation data, what is her probability of being successful on at least one out of two free throw attempts? A 30% B 60% C 70% D 80%
Example 5 A basketball player expects that she has an 60% chance of scoring each time that she attempts a free throw. She wants to know the probability of scoring on one out of two consecutive free throw attempts. She uses a random number generator to conduct a simulation, where the digits 0 through 5 represent a successful free throw. Her simulation results for 10 trials are shown below. 21 64 79 85 48 17 72 96 00 74 Based on her simulation data, what is her probability of being successful on at least one out of two free throw attempts? A 30% B 60% C 70% D 80%
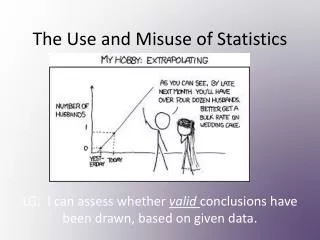
People often misuse statistics; this leads to inaccurate conclusions!
0.5 0.4 0.3 0.2 0.1 Height (mm) M T W TH F Misleading scales could distort the data: PLANT HEIGHT MEASURED AT NOON Has the plant grown a lot from noon on Monday to noon on Friday??? Day
Biased sampling could lead to a wrong prediction: • You would like to know how many students at Eastern High School buy school lunches. Thirty-five of the first hundred students who enter the cafeteria buy lunch. • Can you estimate that 35% of Eastern’s students buy lunch????
Making predictions too far outside a sample or data set can cause inaccuracy: • Research shows that the population of a city has grown steadily at an average rate of 4% in each of the last 10 years. • Can you accurately predict that the city will grow by 4% in the year 2020???
Using different measures of central tendencies can cause different conclusions: • These are the ages of 6 cousins: 1 2 5 6 6 22 • Is it correct to claim that the “average” age is 7 years old, since this is the mean of the data???