Download
1 / 19
190 likes | 276 Vues
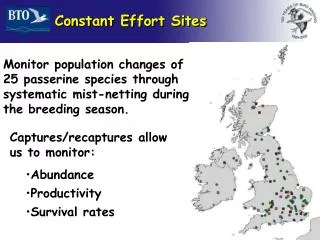
Systematic mist-netting of 25 passerine species throughout the breeding season for abundance, productivity, and survival rates monitoring. Long-term CES habitats fieldwork in Europe, emphasizing trends, breeding success, and integrated population monitoring.

E N D
Constant Effort Sites Monitor population changes of 25 passerine species through systematic mist-netting during the breeding season. • Captures/recaptures allowus to monitor: • Abundance • Productivity • Survival rates
CES fieldwork Twelve visits between May and August, spread evenly through the breeding season (avoiding main migration periods) Using the same number of nets in the same positions on each visit and from year to year Starting at dawn (usually) and ringing for c.6 hours on each visit Regular habitat management to minimise change No tape lures or artificial food
CES in Europe UK, Finland and France are the longest running schemes Recently joined: Denmark Serbia & Montenegro Norway Turkey
BreedingBird Survey (CommonBirds Census) Nest RecordScheme ConstantEffort Sites Ringing PopulationLevels BreedingSuccess Survival Population Models Integrated Population Monitoring
Adult abundance Juvenile abundance Productivity CES trends 1983-2006
Breeding Bird Survey trends England: -29% Scotland: +40% Regional abundance
Survival and weather II Actual survival rates (red) compared to survival rates predicted using winter temperatures (black)
CES and wet weather Lowest ever productivity (2007) Reed Warbler Whitethroat Willow Warbler Willow Tit Blue Tit Treecreeper Lowest ever productivity (2008) Robin Garden Warbler Great Tit
Nightingale DKC 9P86821 1 May 2002, Tipperne, Denmark 7 June 2003, Bainton CES, Cambs 6 May 2006, Bainton CES, Cambs
Reed Warbler P713544 5 June 2001, Bainton CES, Cambs 4 May 2002, Isolino, Italy 13 May 2004, Bainton CES 31 May 2005, Bainton CES (7 June, 14 June, 5 July) 2 July 2006, Bainton CES
Social stats Based on a typical site of three ringers, valiantly making 12 visits each year, each visit lasting six hours and operating six 18m nets Annually per site Annually nationally Total length of nets erected 6 x 18m x 12 = 1.3km x 120 = 156km Total distance walked 12 rounds x 1.3 km x 3 = 46.7km x 120 = 5,598km Total cups of tea drunk 6 x 3 x 12 = 216 x 120 = 25,920 Total number of times threatened to give up 3 x 12 = 36 x 120 = 4,320