Download
1 / 6
60 likes | 354 Vues
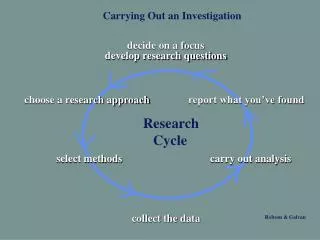
Carrying out an Empirical Project. A researcher conducting an empirical study follows these basic steps : formulate a model gather the data estimate the model subject the model to hypothesis testing interpret the results Model formulation- Single equation models

E N D
Carrying out an Empirical Project • A researcher conducting an empirical study follows these basic steps: • formulate a model • gather the data • estimate the model • subject the model to hypothesis testing • interpret the results • Model formulation- • Single equation models • Simultaneous equation models • Examples-
Hedonic price index model- • in this model the price of a commodity depends on its characteristics. For example, we have a real estate agent who wants to relate the sales price of a house to its characteristics: lot size, living area, number of bedrooms and bathrooms, types of built-in appliances, whether or not it has a swimming pool, whether it has a view, etc. In this model the marginal effect of a characteristic on the price is the “shadow value” of the characteristic. • Simple hedonic model Price= a + bSqft + cBaths + dBedrms • Capital Asset Pricing Model (CAPM) • this model provides a general framework for analyzing risk-return relationships for assets. Let r be the return on a particular security, rm be the return on the market portfolio, and rf be the return of a risk-free return. Let Y=r-rf be the excess returns of the market average portfolio. Then the following is the standard CAPM model: • Y=bx+u • A security for which the beta is larger than one is more volatile than the market and one for which the beta is smaller than one is less.
Data Gathering • Model estimation • Hypothesis Testing • Interpretation of the Results • Select a topic? • One systematic way to approach the problem of choosing a specific topic is to utilize the classification system of the Journal of Economic Literature. • Scan in table 14.1 (p. 652) from R • Review the literature • again the JEL is a good place to start • Collection of the Data- • where do you go? • For data at the international level one can go to the International Financial Statistics (IMF), World Development Report (World Bank), Penn World Tables • For data at the national level-US data from the BLS, NBER, Federal Reserve Board
For data at the regional or state level there is state-by-state the Economic Report of the Governor which usually has statistical appendices. There is also the State and Metropolitan Data Book which is a supplement to the Statistical Abstract of the Unite States. • Specialized data sources include the Survey of Current Business, often organized by SIC codes (standard industry classification). Federal Reserve Bulletin has detailed financial statistics. Standard and Poors and Moody’s have ratings of securities and other financial information. • Journals such as the Journal of Applied Econometrics, Journal of Business and Economic Statistics, American Economic Review, Journal of Money, Credit and Banking, have online archives of data used in empirical studies. • Preliminary Empirical Analysis • Box plots, check for the presence of outliers, summary statistics such as mean, median, standard deviations, coefficient of variation (one rule of thumb is to rule out variables whose CV<.05), and well as the correlation matrix. • If the data is a time series plot the series against time to get an understanding of possible periodicities as well as trend and growth rate properties.
Model Estimation and Hypothesis Testing • If you have enough data split the sample into two parts. • The first will be used to analyze alternative specifications and examine significance of particular explanatory variables, functional form, etc. • The second is to be used for your final estimations based on what you have learned from the first subsample. • Next estimate the general model that you have formulated. • Examine the fit (adjusted and unadjusted R-squared), significance and reasonableness of coefficients. • Often this part of the analysis is complicated by poor initial results and may require a good bit of judgment. • Diagnostics and formal specification checks for serial correlation, heteroskedasticity, nonlinearities, interactions, ommitted variables, and possible simulatenous equations bias can be assessed using a battery of Wald and Lagrange multiplier tests discussed in the Ramanathan text. • Once you have a specification that has met with formal statistical criteria as well as with the “smell test” of reasonableness then reestimate using the second subsample • Writing Up Your Results
A suggested outline for writing an empirical report is as follows: • Statement of the problem • review of the literature • formulation of the general model • data sources and descriptions • model estimation and hypothesis testing • interpretation of results and conclusions • limitations of the study and possible extensions • acknowledgements • references and tables