Effective Stages of Exploratory Factor Analysis (EFA): A Comprehensive Guide
160 likes | 324 Vues
This guide outlines the essential stages of conducting Exploratory Factor Analysis (EFA), highlighting data suitability, model selection (PAF or PCA), factor extraction, and rotation processes. It underscores the importance of ensuring data meets specific criteria, such as normality and linear relationships among variables. The guide also discusses how to estimate communalities, determine the number of factors to extract, and the significance of interpreting factor loadings. Additionally, it differentiates between EFA and Confirmatory Factor Analysis (CFA), providing insights into practical applications and common pitfalls.

Effective Stages of Exploratory Factor Analysis (EFA): A Comprehensive Guide
E N D
Presentation Transcript
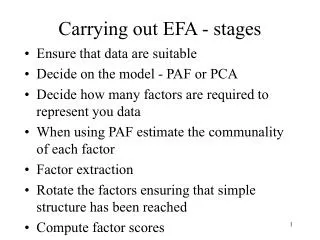
Carrying out EFA - stages • Ensure that data are suitable • Decide on the model - PAF or PCA • Decide how many factors are required to represent you data • When using PAF estimate the communality of each factor • Factor extraction • Rotate the factors ensuring that simple structure has been reached • Compute factor scores
Stage1 - Data suitability • Packages will happily churn out results on any data! • Must be continuous, categorical = inappropriate • Variables are normally distributed and outliers have been appropriately dealt with • Relationship between all variables appear to be linear or at least not U-shaped or J shaped • All variable are independent - thus variables cannot be calculated from any other variables • e.g., if item a was height and b was weight then it would be inappropriate for c to be a height to weight ratio since it would necessarily be correlated to both a and b
Stage1 - Data suitability • There are at least some correlations in the matrix that are above .3 • If correlations are smaller than this then there would seem to be no real relationship between any of the items • Must be at least 100 participants and more participants than items • Nunnally (1978) advocates 10 times as many participants as items • Barrett & Kline (1981) so long as no. of Ps > than items then ratio is not as important
Stage 2 - Model • The PCA is the simplest - sufficient for any analysis performed at an undergraduate level • Carroll argues is nonsense since all items must have unique variance Stage 3 - deciding on No. of factors to extract • Theory and past experience • If increasing the number of factors does not increase the simplicity then it is of little use - result should always be plausible • Large correlations (>.5) between factors should be considered as suspect
Identifying No. of Factors • Different tests produce different results • Kaiser-Guttman criterion - generated factors with eigenvalues above 1 are removed as real factors • Problem - is sensitive to the number of items. Increase in items = increase in eigenvalue. • Scree test - based on eigenvalues of an unrotated PC solution - depends on the relative values of eigenvalues and therefore should be independent of item number
2 Factors to be extracted • Going from left to right draw the first straight line that shows the data leveling of - elbow • No. of factors = the number of factors above this line
Stage 4 - Estimation of the communality • PCA - assumed to be 100% and therefore no estimation required • With PAF no agreed way to do this
I2 I1 F1 I3 I4 F2 Stage 5 - Factor extraction • Initially factors are placed arbitrarily • Successive factors are placed • At right angles to each other • In a position that explains a substantial amount of variance of the items
Stage 6 - Factor rotation • Changes the position of the factors to ease interpretation • Each factor should have some large loadings and some small ones - each factor should only have substantial loadings on only a few items - known as simple structure • Large number of mediocre loadings should be avoided
Table showing rotated and unrotated solutions for 4 hypothetical items Notice • Communality of each variable remains the same • Eigenvalues do not • Factors are positioned such that the variance of the squared loadings is as large as possible - most stat packages use VARIMAX • MAXimises the VARIance of the (squared factor loadings)
Factor scores • Score on anyone factor can be determined by considering the responses to items that load onto that factor • Can take into account the factor loading such that item with greater loading have a higher weighting • Factor scores are determined through the sum of scores produced on all the relevant items
Hierarchical FA • If factors are obliquely rotated the resultant matrix of correlations can itself be factor-analysed – hierarchical analysis or second-order analysis • Can be difficult to conceptualise what such a higher order factor might represent
EFA vs CFA • EFA seeks to determine the number and nature of factors which underpin a set of data • CFA allows you to choose between alternative hypotheses which purport to represent your data • Given a set of data you could determine which factor theory of personality best represented the data
CFA • Can be carried out by principle axis factoring or principle components method • Is the simplest form of Structural equation modelling • Packages that have been created specially to perform EFA • LISREL • EQS
Errors of Factor Analysis • Interpreting the unrotated solution • Applying rigid rules to the extraction of factors – KG vs Scree method. Which solution makes most sense? • Replication is very important • Factor validity is not attested to only by item content (face validity). Must be compared with some other measure