1 / 7

Solar Cell Fabrication Process Comparison

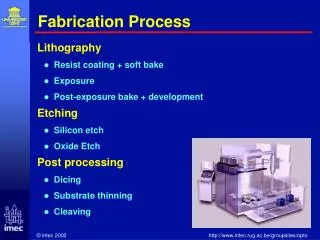
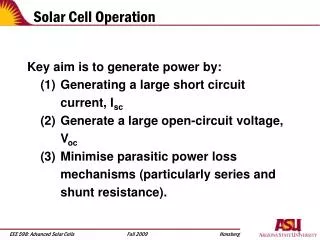
Solar Cell Fabrication Process Comparison. For final PP report. Solar Cell Top Contact design used for this comparison. Cell size: 2.19 cm x 7.14 cm. Variable for process fabrication. Fab 1 – Aluminum top conductor Fab2 – Cr/Au top conductor. Fab 1 – I/V curve. Fab 2 – I/V curve.

Télécharger la présentation

Solar Cell Fabrication Process Comparison

An Image/Link below is provided (as is) to download presentation Download Policy: Content on the Website is provided to you AS IS for your information and personal use and may not be sold / licensed / shared on other websites without getting consent from its author. Content is provided to you AS IS for your information and personal use only. Download presentation by click this link. While downloading, if for some reason you are not able to download a presentation, the publisher may have deleted the file from their server. During download, if you can't get a presentation, the file might be deleted by the publisher.

E N D

Presentation Transcript


  1. Solar Cell Fabrication Process Comparison For final PP report

  2. Solar Cell Top Contact design used for this comparison Cell size: 2.19 cm x 7.14 cm

  3. Variable for process fabrication Fab 1 – Aluminum top conductor Fab2 – Cr/Au top conductor

  4. Fab 1 – I/V curve

  5. Fab 2 – I/V curve

  6. Table summarizes the results

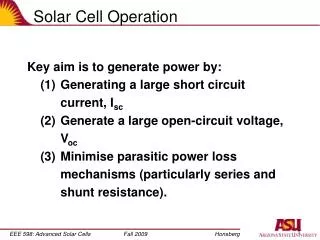
  7. Conclusion The Cr/Au top contact metal did not improve performance The Cr/Au top contact metal significantly reduced performance Possible cause of decreased performance – Cr sub-layer required for gold adds resistance to conductor

More Related