Energy Use Management
11/18/2011. Systems Research Institute. 2. Definitions. EnergyThe ability to do work UseThe act or practice of employing something ManagementJudicious use of means to accomplish an endConservationA careful preservation and protection of something . 11/18/2011. Systems Research Institute. 3. Terminologies.

Energy Use Management
E N D
Presentation Transcript
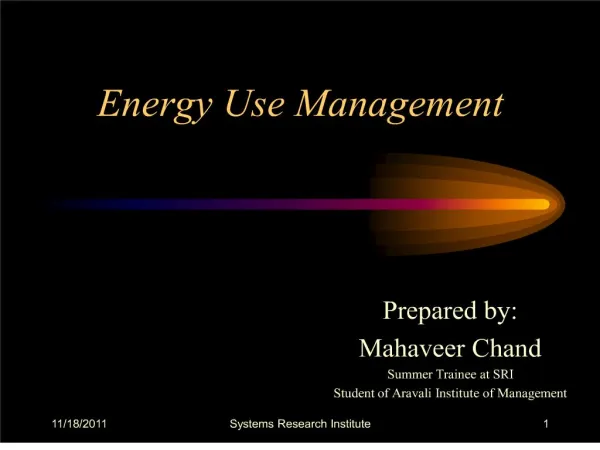
1. 11/18/2011 Systems Research Institute 1 Energy Use Management Prepared by:
Mahaveer Chand
Summer Trainee at SRI
Student of Aravali Institute of Management
2. 11/18/2011 Systems Research Institute 2 Definitions Energy
The ability to do work
Use
The act or practice of employing something
Management
Judicious use of means to accomplish an end
Conservation
A careful preservation and protection of something Energy Use Management: the act or practice of employing the ability to do work judiciously to accomplish an endEnergy Use Management: the act or practice of employing the ability to do work judiciously to accomplish an end
3. 11/18/2011 Systems Research Institute 3 Terminologies Alternative Energy
Energy derived from sources that do not use up natural resources or harm the environment
ERoEI: Energy Returned On Energy Invested
Energy Invested
In order to acquire, transport, store and use energy, it TAKES energy
Energy Returned
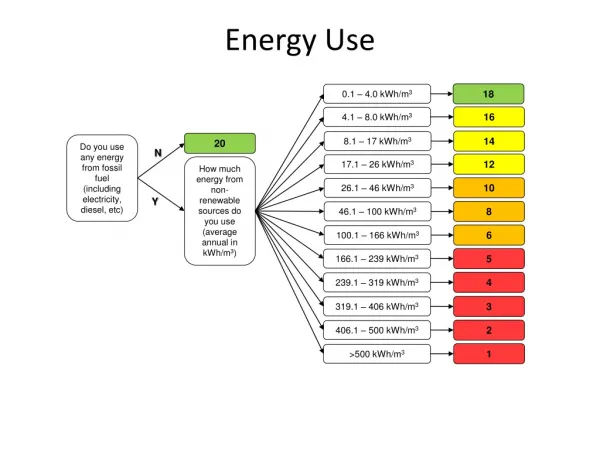
After you have taken into account all the energy used above...HOW MUCH energy do you have left with?
4. 11/18/2011 Systems Research Institute 4 Sources of Energy Non-Renewable
Oil
Gas
Coal
Nuclear Renewable
Wind
Solar
Hydel
Biomass
Hydrogen
Geothermal Energy
Ocean Thermal
5. 11/18/2011 Systems Research Institute 5
6. 11/18/2011 Systems Research Institute 6
7. 11/18/2011 Systems Research Institute 7 Comparisons of India's Energy to World and China
8. 11/18/2011 Systems Research Institute 8 Oil Oil reserves have got a great imbalance, where top 20 countries have 975 Billion bbls of reserves, rest of the world has 57 Billion bbls of reserves
Oil Demand - World
75.99 Mb/d* (2001) 81.08 Mb/d* (2004)
Oil Production - World
75.22 Mb/d* (2001)
Oil Demand - India
2.27 Mb/d (2001) 2.46 Mb/d (2004) Problematic: not definite or settled Problematic: not definite or settled
9. 11/18/2011 Systems Research Institute 9 Contd� Europe-Japan-US consume 12-25 barrels/capita-year, McKillop, 2004
India consume 1.5 barrels/capita-year
Demand for oil is growing by 1.5 Mb/d per annum - World
ASPO* predicts world oil production will peak around 2007
World oil spare capacity has come down to 2 Mb/d in 2003 probably the lowest since World War II
10. 11/18/2011 Systems Research Institute 10 Contd� Oil production is declining in Samotlor (Russia�s largest oilfield)
Production of Norway decreased by 10% in 2005
UK oil production has decreased by 30% since 1999
Mexico's super giant Cantrell oilfield is now in decline
11. 11/18/2011 Systems Research Institute 11 Contd� Four OPEC countries has passed peak of which Indonesia has become net importer of oil
All OECD oil exporters has passed peak
Net increase in oil reserves after the explorations and findings of new fields is negative since 1980
Crude oil prices has gone up from $26 per barrel in May 2003 to $ 74 per barrel in May 2006 (Scarcity Premium: $ 20-30 )
12. 11/18/2011 Systems Research Institute 12 Crude Oil: India
13. 11/18/2011 Systems Research Institute 13 Natural Gas Production: 9.5 million boe/day - World (2001)
The production of natural gas will peak between 2020 and 2030 - World
India does not have large gas reserves
India�s Natural Gas Demand/Production (in MCM)
31763 (2004-05) 32205 (2005-06)
OR
0.547 Mboe/day 0.555 Mboe/day
14. 11/18/2011 Systems Research Institute 14 Natural Gas: India
15. 11/18/2011 Systems Research Institute 15 Coal Over 3,650 million tonnes (Mt) of hard coal were produced in 1998 half of which was used for electricity generation
Coal would last for next 80 � 100 years
India has a large reserves of coal but of lower quality
Coal has the highest emission of CO2 among all fossil fuels
16. 11/18/2011 Systems Research Institute 16 Coal and Lignite: India
17. 11/18/2011 Systems Research Institute 17 Consumer wise off take of Coal
18. 11/18/2011 Systems Research Institute 18
19. 11/18/2011 Systems Research Institute 19 Nuclear Power Carbon emission from nuclear fission is low but there are many serious environmental issues which do not even have any solution
Cost of production is low as compared to other systems but the capital investment required, operation and maintenance expenses are high
Cost of disposing the radioactive waste after the plant closing is tremendous
20. 11/18/2011 Systems Research Institute 20 Contd� Radioactive waste produced by nuclear power till now is not yet de-commissioned
Moreover, the production will take at least twenty years
21. 11/18/2011 Systems Research Institute 21 Wind ERoEI for wind is 80-100
Construction period is short: 2-20 weeks
No carbon emission, no fuels required, no disposal cost and low maintenance
Energy losses in transmission is as low as 4% over a distance of 1000 kms. of HVDC
Overall efficiency is 20-25% with a life of 20-25 years
Wind energy grew by 25% for last 10 years
India has a installed capacity of 4.5 GW while the potential is of 45 GW
22. 11/18/2011 Systems Research Institute 22 Solar The average solar radiation in India is 4-7 kWh/m2/day with 300 clear sunny days in a year
SWHS: 700,000 sq. m installed capacity with a potential of 140 million sq. m
SAHS: 5,000 sq. m installed capacity 541,000 Solar Cookers in use
World�s largest solar cooking venue in Tirupati (15000 people/day)
140 MW Integrated Solar Combined Cycle with a solar thermal component of 35 MW power project near Jodhpur (first of its kind in India)
23. 11/18/2011 Systems Research Institute 23 Biomass The energy from plants and plant derived materials
Biomass can be used for fuels, power production and products
24. 11/18/2011 Systems Research Institute 24 Biofuels India has 62 million hectares of wasteland1
Corporate farming can create 15 m new jobs
Two most common biofuels are Ethanol and Biodiesel
Biofuels can be produced from Palm Oil, Jatropha, Rice Husk, Wheat Husk, etc.
Per hectare Jatropha seed yield which starts from the 1 yr. @ 500 kg / ha goes up to 6-12 MT/ha/yr in 3rd and 4th year2
25. 11/18/2011 Systems Research Institute 25 Butanol Can be produced from corn and other biomass
One bushel of corn can yield 2.5 gallons of butanol with some hydrogen
It does not produces Sox and Nox so less GHG
Butanol replaces every single drop of gasoline without engine modification
Hydrocarbon emission-5%, CO-Nil, NxOy-63%
26. 11/18/2011 Systems Research Institute 26 Comparison
27. 11/18/2011 Systems Research Institute 27 Hydrogen 2700 times less energy dense than petrol
Three ways to reduce in size
Compression
Liquefaction
Chemical-combination
13% more tankers are required if transported by road
By pipelines, 33% is wasted for a 3000 km. line
28. 11/18/2011 Systems Research Institute 28 Geothermal Energy Generated by mining the earth�s heat
Current electricity generation is about 9000 MW of which US produces 1/3rd
Nearly 400 low to medium enthalpy thermal springs exist in India
Total power generating capacity is estimated to be 10,000 MW in India
This can be best utilize in food production and food processing
29. 11/18/2011 Systems Research Institute 29 Ocean Thermal Energy Conversion OTEC is a way to generate electricity using the temperature difference of seawater at different depth with an overall efficiency of 1 to 3%
India piloted a 1 MW floating OTEC plant near Tamil Nadu (working on trial basis)
30. 11/18/2011 Systems Research Institute 30 ERoEI
31. 11/18/2011 Systems Research Institute 31 Renewables: India
32. 11/18/2011 Systems Research Institute 32 Energy Conservation Energy Saving Devices (ESD) can save up to 40% energy per day for street lighting
Replacing incandescent bulb (60W) with compact fluorescent bulb (18W) will reduce power consumption by 70% (Pay-back: 1Yr)
Using electronic ballasts can increases lamps efficiency by 25% and light output by 10-15%
Using Economizer in air conditioners reduces power consumption
33. 11/18/2011 Systems Research Institute 33 Case Study: Mother Dairy
34. 11/18/2011 Systems Research Institute 34 Mother Dairy: Corrective Measures Taken Water content in ammonia was decreased from 4.5% to 1% which was consuming more energy resulted in consumption reduction of 154249 kWh with an investment of Rs. 65,000 only
35. 11/18/2011 Systems Research Institute 35 Case Study: RIL (Refinery Division) Reduction in hydrocarbon flaring from 53 to 10 Tons per day
Measures Taken
Installed a skid mounted flare gas recovery system
A Flare Gas Amine Absorber
Investment of Rs.10.08 cr. with payback period of 9 months
36. 11/18/2011 Systems Research Institute 36 World Scenario (2000)
37. 11/18/2011 Systems Research Institute 37 World Scenario (2005)
38. 11/18/2011 Systems Research Institute 38 Energy Guzzlers Agriculture
Transport
Industries
Household
Municipalities
39. 11/18/2011 Systems Research Institute 39 Agriculture One of the largest direct and indirect energy consumer
40. 11/18/2011 Systems Research Institute 40