Download

1 / 131
1.33k likes | 1.58k Vues
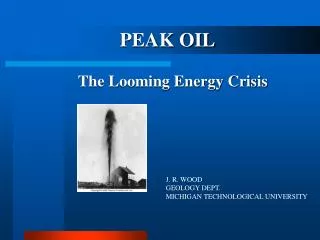
PEAK OIL. The Looming Energy Crisis. J. R. WOOD GEOLOGY DEPT. MICHIGAN TECHNOLOGICAL UNIVERSITY. ANNUAL PRODUCTION OF CRUDE OIL ACTUAL & PROJECTED. SOURCE: ASPO, 2004. U.S. energy consumption, 2001 . US CRUDE CONSUMPTION. ANNUAL CRUDE OIL CONSUMPTION IN THE US & SOURCES.

E N D
PEAK OIL The Looming Energy Crisis J. R. WOOD GEOLOGY DEPT. MICHIGAN TECHNOLOGICAL UNIVERSITY
ANNUAL PRODUCTION OF CRUDE OIL ACTUAL & PROJECTED SOURCE: ASPO, 2004
US CRUDE CONSUMPTION ANNUAL CRUDE OIL CONSUMPTION IN THE US & SOURCES
GDP AND OIL CONSUMPTION DEPENDENCE OF NATIONAL GDP ON OIL CONSUMPTION: 67 COUNTRIES GDP (PPP)
WORLD ENERGY CONSUMPTION EXXON-MOBIL
THE DEBATE OVER RESERVES: PESSIMISTS AND OPTIMISTS During the 1990’s, the debate over oil reserves generated controversy between the "pessimists" and the "optimists".
OIL IS POLITICAL “Oil is so important that publishing reserve data has become a political act. Most of the dispute between the so-called pessimists (mainly retired geologists) and the optimists (mainly economists) is due to their using different sources of information and different definitions. The pessimists use technical (confidential) data, whereas the optimists use the political (published) data. “ Jean Laherrère "Future of oil supplies” Seminar Center of Energy Conversion Zurich May 7 2003
PESSIMISTS • the world is finite and so are its recoverable oil resources • all of the oil-bearing regions worth exploring have already been explored • the big fields have already been discovered • claim that official figures for proven reserves have been overestimated • world oil production is currently at its optimum (peak) and will decrease steadily • Geologists and physicists tend to hold this position.
OPTIMISTS • hold a “dynamic” concept of reserves • believe that volumes of exploitable oil and gas are closely correlated to technological advances, technical costs and price • tend to be economists
the economist sees economic activity as a function of infinite "money creation", rather than a function of finite "energy stocks" and finite "energy flows". In fact, the economy is 100% dependent on available energy -- it always has been, and it always will be. THE “FLAT EARTHER’S” PRODUCTION CURVE “… often assumed by economists that oil production can simply be increased to keep pace with consumption until the wells finally and suddenly run dry.” http://wolf.readinglitho.co.uk/index.html
Summary: Optimists and Pessimists Will the hydrocarbon era finish soon? Oct. 2000 H. Rempel, Federal Institute for Geosciences and Natural Resources, Stilleweg 2, 30655 Hannover
World - Regular Oil Peak Discovery 1964 High Prices Curb Demand Ultimate : 1850 GbTo-date 2003: 920 Gb
WORLD OIL DISCOVERIES Oil discoveries worldwide peaked at 90 Gb in 1964 (except for an exceptional, solitary peak year in 1948 of 147 Gb. It clearly shows the fall in discovery. Even the successes such as North Sea oil in the mid-1970s do not halt the trend,. Source: ASPO • “You have to find it before you can produce it “ • Production mirrors discovery after a time lag 3 YEAR AVERAGE
Production mirrors discovery … Drilling more does not help After a time lag of ~35 years for the US Lower 48.
Real Discovery Trend Past discovery by ExxonMobil
Production mirrors discovery … Drilling more does not help … for the world?
The Growing Gapbetween Discovery and Consumption Drilling more does not help
BUT “OFFICIAL” PROJECTIONS CONFUSE … SOURCE: EIA & USGS
Regular Oil • How Much has been Found? 1700 Gb (rounded) • When was it found? Peak discovery was in 1964
ESTIMATTES OF ULTIMATE RECOVERY “The attached graph shows 76 estimates of ultimate recover estimates published by major oil companies and serious scientific institutions. There is a consensus, ... from which only a few eccentric high estimates depart (that) ... the average works out at 1930 Gb, of which 920 Gb, or almost half (48%), have been consumed.” • How Much has been Found? 1700 Gb (rounded) • When was it found? Peak discovery was in 1964
RESERVE ESTIMATES • RESERVES ARE:ORIGINAL OIL IN PLACE – PRODUCTION • RELIABLE DATA ARE HARD TO COME BY • “RESERVE GROWTH” IS REAL BUT SOMETIMES HARD TO VERIFY • PRIME DIFFERENCE BETWEEN “OPTIMISTS” AND “PESSIMISTS”
“Political” Reserves • Companies officially under-report where they can. Stock Exchanges encourage under-reporting • Countries variously • Under-report based on company returns • Over-report, for example, for OPEC quota • Simply fail to update - 68 countries in 2003
STANDARD SOURCES OF DATA “Reserves published as “proved” by Oil & Gas Journal (OGJ), World Oil, BP Statistical Review, American Petroleum Institute and OPEC, can be called “political” (or financial).” Jean Laherrère "Future of oil supplies” Seminar Center of Energy Conversion Zurich May 7 2003 • STNADARD SOURCES • OIL & GAS JOUIRNAL • WORLD OIL • BP STATISICAL REVIEW • API (DOE) • OPEC OGJ and World Oil simply report what governments and companies send themBP uses OGJ & WO data but does not filter, QC or apply institutional knowledge API and OPEC are meant to be political
World DiscoveryThe Popular Image Based on non-backdated revisions
Reality and Illusion Flat-earth illusion Inflection due to falling Discovery Reality OPEC “quota war”
Spurious OPEC Reserve Revisions OPEC PRODUCTION QUOTAS DEPEND ON STATED RESERVES THE TEMPTATION TO EXAGGERATE PROVED IRRESISTABLE In billions of bbls.
Misleading Reporting by BP Statistical Review Genuine revisions not back dated !
WORLD OIL RESERVES - BP STATISTICS The BP statistics for the world's proved reserves of oil are unrealistic, showing the unsupported OPEC leap in the 1980s and a steady increase despite years when consumption was greater than discovery. Source: BP
THE CRUDE OIL CRISIS • So, what does it mean … • if WORLD CRUDE PRODUCTION IS PRESENTLY PEAKING, • if MOST OF THE WORLD’S OIL HAS BEEN DISCOVERED, • and if WORLD DEMAND CONTINUES TO GROW?
if WORLD CRUDE PRODUCTION IS PRESENTLY PEAKING • Just the perception that oil is peaking will be a problem • Financial markets can be counted on to react badly • Governments too; some may even consider going to war • General population will bear the brunt, esp. in poorer, undeveloped countries End of cheap oil Exxon stock anyone? Really a stretch, Dr. Wood Population crash?
if most of the World’s oil has been discovered The OPEC/Middle East Crossoverv • One consequence: • OPEC is expected to produce more than 50% of the world's oil around 2010, • How will Western economies cope? Oil production comparing OPEC with the Rest of the World. Source: ASPO
Population Trends – Less & More Developed countries may squeak by IF energy alternatives can be found and put on line quickly enough. If these population projections are at all correct, then less developed countries have no chance. Developed countries will not let their economies crumble under the oil threat. As long as significant quantities of oil remain, the developed countries will fight to maintain share. Less developed countries will suffer in comparison as they will be shut out of oil markets, probably even if they own the supplies. Source: UN Population Trend Data
The Olduvai Theory of Industrial Civilization THE ANTHROPOLOGIST’S PERSPECTIVE? EXAGGERATED? PERHAPS, BUT THE OIL AGE WILL BE REMEMBERED AS A TIME WHEN MANKIND WENT THROUGH 100’S OF MILLIONS OF YEARS OF HYDROCARBON RESOURCES IN LESS THAN 200 YEARS. The Olduvai Theory: Sliding Towards a Post-Industrial Stone Age. Richard C Duncan, Ph.D. Institute on Energy and Man, June 27, 1996
THE CRITICAL IMPORTANCE OF GIANT FIELDS Saudi Arabia has over 300 recognized reservoirs but 90% of its oil comes from the five super giant fields discovered between 1940 and 1965. Since the 1970s there haven't been new discoveries of giant fields. IAGS, 2004, “New study raises doubts about Saudi oil reserves “ AAPG EXPLORER, JAN., 2005
GIANT OIL FIELDS* * >500 MILLION BBLS Fit Results Fit 1: Normal Number of data points used = 876 Average X = 1966.26 Standard Deviation = 21.5462 • HISTOGRAM CONTAINS 876 FIELDS WORLDWIDE • RATE OF DISCOVERY CLEARLY IN DECLINE • DISCOVERY PEAKED IN 1966
Saudi Arabia's Ghawar Field Discovered in 1948, Ghawar is the world's biggest oil field, 174 miles in length and 16 miles across and encompasses 1.3 million acres.Current estimates, for cumulative oil production are 55 billion barrels. Average production for the last 10 years is five million barrels per day. Ghawar accounts for more than one-half of all oil production in Saudi Arabia
ANNUAL PRODUCTION OF CRUDE OIL SOURCE: ASPO, 2004
WORLD OIL & THE HUBBERT CURVE The yellow line in the graph is the Hubbert curve and shows how oil production would have expanded and then contracted if it had been governed solely by physical constraints. The red line shows the amount of oil actually produced up to 2003 and what is likely to be produced in the future. The actual curve followed the theoretical curve very closely until the early 1970s when five OPEC producers gained control of more than 30% of the world market. This pushed up prices, limiting demand. High oil prices can be expected to cause world oil demand to stay on a plateau until around 2010. After that, output will fall whatever the price because fields will be becoming exhausted. Peak Discovery 1964 World - Regular Oil Ultimate :1850 Gb To-date 2003 : 920 Gb
ENERGY CONVERSIONS • 1 BARREL OF OIL • = 6.1 GJ • = 5.8 X 10 6 BTU • = 1,700 kilo-watt-hr (kWh) • = 42 gallons (U. S) • 7.2 BARRELS OF OIL = 1 ton of oil (= 42-45 GJ)
“Reserve Growth” misleads • “Reserve Growth” misleads. • It is widely attributed to technology, market forces or good management, but is simply a reporting phenomenon. • Proved Reserves grow by definition • Proved & Probable Reserves do not • Revisions have to be backdated to obtain a valid discovery trend.
Data Sources • Two trade journals Oil & Gas Journal and World Oil compile data given to them by governments but do not assess validity • BP reproduces the Oil & Gas Journal • But does not reveal its own knowledge • Industry databases give the best available data but is too expensive for most analysts to access