Download
1 / 11
110 likes | 368 Vues
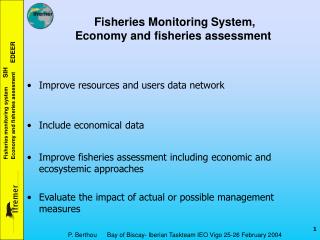
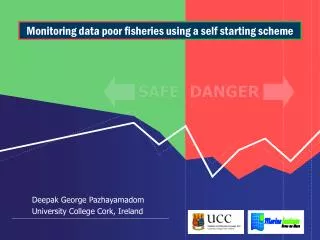
Monitoring data poor fisheries using a self starting scheme. Deepak George Pazhayamadom University College Cork, Ireland. SAFE. DANGER. Indicator based management using traffic light approach. Empirical indicators e.g. Mean length or Mean weight.

E N D
Monitoring data poor fisheries using a self starting scheme Deepak George Pazhayamadom University College Cork, Ireland SAFE DANGER
Indicator based management using traffic light approach • Empirical indicators e.g. Mean length or Mean weight • Reference directions e.g. Increased or decreased? • Reference limit e.g. Whether management required or not? Limit - 18cm Precautionary - 25cm Acceptable - 28cm
Statistical Process Control (SPC)- Shewhart control chart (A Statistical framework for traffic light approach) True Positive True Negative False Positive False Negative
Statistical Process Control (SPC)- CUSUM control chart [zt=(D-µ)/σ] D = Indicator(Time Series) µ = Control Mean (Target) σ = Standard Deviation
Self starting CUSUM control chart (SS-CUSUM) Is it useful to monitor data poor fisheries?
Methods - Fisheries Simulation SS-CUSUM
Methods - Stock Indicators • Mean Age 2. Mean Length 3. Mean Weight 4. Large Fish Catch Numbers (LFCN) e.g. LFCN = 30/100 5. Large Fish Catch Weight (LFCW) n=1 n=4 n=25 n=35 n=20 n=10 n=5 Age 1 Age 2 Age 3 Age 4 Age 5 Age 6 Age 7
Methods - An example scenario • Monitored 20 years • Fixed parameters (k=0.5, h=0) • Collected data on TP, TN, FP, FN • Repeated 1000 times Repeated for control limit (h) ranging from 0 to 6 with 0.1 interval
Results - Performance Measures • Receiver Operator Characteristic (ROC) Curve (Sensitivity Vs 1-Specificity) Sensitivity – Probability of True Positive signals Specificity – Probability of True Negatives 2. Optimal Performance (Sensitivity=Specificity)
Acknowledgements Emer Rogan University College Cork, Ireland Ciaran Kelly Marine Institute, Ireland Edward A. Codling University of Essex, UK Thank You Any questions? deepakgeorgep@student.ucc.ie