Download
1 / 18
180 likes | 204 Vues
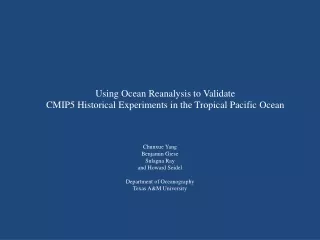
This study assesses the accuracy of CMIP5 models in simulating El Niño events by comparing historical experiments with ocean reanalysis data. Findings indicate realistic ENSO strength and location, with minimal changes over the last century. However, models struggle to capture the asymmetry between El Niño and La Niña. The analysis covers the period from 1850 to 2005 and includes 10 models, offering valuable insights into climate model performance in the tropical Pacific Ocean.

E N D
Using Ocean Reanalysis to Validate CMIP5 Historical Experiments in the Tropical Pacific Ocean Chunxue Yang Benjamin Giese Sulagna Ray and Howard Seidel Department of Oceanography Texas A&M University
How well do CMIP5 coupled models simulate El Niño? • Does El Niño change in CMIP5 coupled models during the last century?
CMIP5 Historical Experiment • Most cover from 1850 to 2005, except HadCM3 covers from 1860 to 2005 • Forcing: Observed atmospheric composition changes (Reflecting both natural and anthropogenic sources) • Ensemble experiments (ranging from 3 to 10 members) • 10 models available at the time of this study
SODA 2.2.6 • Eight Ensemble Members • Numerics • Parallel Ocean Program • Domain • Global (including Arctic) • Resolution • 0.4x0.25 average (~25km x 25km midlat) horizontal • 40 levels: 10m near surface to 450m in deep ocean • Winds • Eight Ensemble members of 20CRv2 daily stress 1871 – 2008 • Heat and Salt fluxes • Bulk formulae using 20CRv2 daily variables • SODA Data Assimilation • ICOADS 2.5 SST data
Averaged El Niño BCC-CSM1-1 SODA_2.2.6 CanESM2 CNRM-CM5 CSIRO-MK3-6-0 GISS-E2-R IPSL-CM5A-LR HadCM3 MIROC-ESM MPI-ESM1-M NorESM-M
Niño 3.4 SST SODA_2.2.6 HadCM3 MIROC-ESM BCC
Center of Heat Index (CHI) The first moment of SST anomaly, based on the location of SST anomalies greater than 0.5°C within a strip that spans the tropical Pacific (120°E-70°W, 5°S-5°N). The warm area has to be greater than or equal to the area of the Niño 3.4 region.
Conclusions • Most of the CMIP5 models have realistic ENSO strength and location. • ENSO does not change much in the last century in SODA_2.2.6 and CMIP5 coupled models. • Most of the models do not capture the asymmetry between El Niño and La Niña.