Download
1 / 41
410 likes | 783 Vues
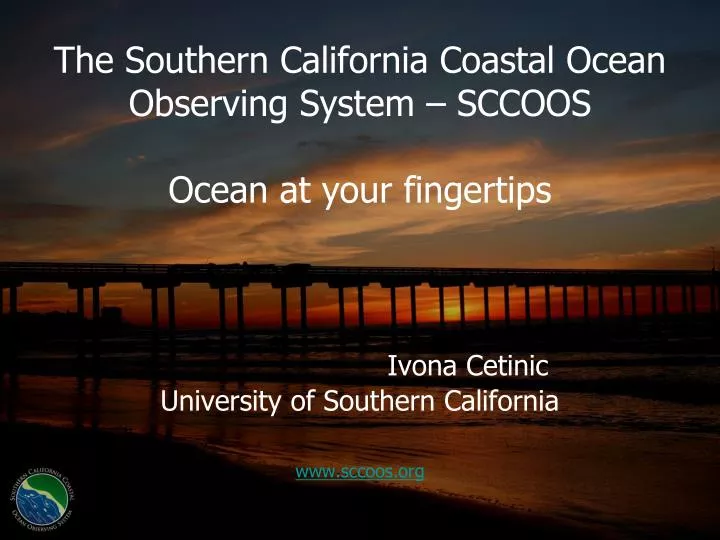
The Southern California Coastal Ocean Observing System – SCCOOS Ocean at your fingertips Ivona Cetinic University of Southern California www.sccoos.org. Outline. Overview Ocean observing systems - general History of SCCOOS SCCOOS today – who how where Primary Elements of SCCOOS

E N D
The Southern California Coastal Ocean Observing System – SCCOOSOcean at your fingertipsIvona CetinicUniversity of Southern Californiawww.sccoos.org
Outline • Overview • Ocean observing systems - general • History of SCCOOS • SCCOOS today – who how where • Primary Elements of SCCOOS • Our part in SCCOOS • HF radars • Boat operations • Manual sampling • Gliders • Classroom applications • Ideas for classroom
Ocean observatory systems • networks that can monitor conditions in critical coastal and remote open-ocean locations • provide a continuous flow of data in near-real time to scientists and marine resource managers onshore • provide critical information for research on climate change, biogeochemical cycles, ecosystem assessment, and environmental hazard • enhances presence in the ocean—follow the changes in the ocean over longer period of time From Monterey Bay 2006 field experiment
Discrete vs. Continuous data – household example Lot of unknown gaps in the science too! Continuous, real time data allows us to better interpret processes in the ocean
Development of Collaborative Observational Efforts - Southern California • Historical observing systems • Evolution of NPDES efforts • Specialized observation efforts • Integrated ocean observing system
Historical Ocean Observing Systems in Southern California • CalCOFI (California Cooperative Fisheries Investigations) • >50 years • NOAA Buoys • CDIP – Coastal Wave Prediction • NPDES Permittee Monitoring (Clean Water Act) • Local Monitoring • Regional Monitoring / Assessment beginning 1994 • NEOCO – Pier monitoring (Univ. of Calif.) • Network for Environmental Observations of the Coastal Ocean
Evolution of NPDES Regional Monitoring • Bight 94 (EMAP affiliation) • Goal: State of the Bight • Municipal monitoring agencies only • Agency transition from independent local sampling to regionally coordinated sampling • Bight 98 • Beginning of academic collaboration with monitoring agencies • Water Quality focus on Stormwater Runoff • Bight 03 • Larger role of academic involvement • Collaboration of SCCOOS Components to provide complementary observational tools • Remote sensing • Drifters • HF Radar surface current mapping
Huntington Beach Bacterial Contamination 2000-2002 (Fed’l, State, County, City) USC/SCCWRP Santa Monica Bay Stormwater 1996-97 (Funding: LA County, LA City, Sea Grant) Palos Verdes DDT Contamination 1992-93 (NOAA funded) Imperial Beach Bacterial Contamination 2000-present (State, City) Focused Observational Programs: Specific Problem Areas
Cal Poly, SLO • University of California, Santa Barbara • University of Southern California • University of California, Los Angeles • Jet Propulsion Laboratories • Southern California Coastal Water Research Project • Scripps Institution of Oceanography • CALIT2 • Raytheon Corporation • CODAR Ocean Sensors • NOAA • USGS • ACOE • ONR • OCSD • Los Angeles Regional Board
EDUCATION MONITORING OBSERVING RESEARCH Monitoring:systematic collection of mission driven environmental data to determine current conditions, trends, variation Observing:collection of real-time environmental data for a host of uses Research:scientific investigation and scholarly pursuit of knowledge Education:presentation of information in a manner that people can take action
….the many layers of an integrated coastal observing system • water quality • marine life resources • coastal hazards • educators • search and rescue • spill response • security • regional marine science • …….? • Existing agency monitoring • surface current measurements • satellite and aircraft remote sensing • physical,bio-optical moorings • autonomous vehicles • meteorological measurements • modeling • distributed databases • ……. ? Observing infrastructure End user needs
Partnerships with Agencies, Private companies, NGO community.
Primary Elements of SCCOOS • Coastal Ocean Current Mapping (HF Radar Network) • Meteorological stations • Automated shore stations • Manual shore station • Boat based programs • Moorings + buoys • Gliders • Remote Sensing • Data Assimilation Modeling • Data Base Development and Management
Primary Elements of SCCOOS • Coastal Ocean Current Mapping (HF Radar Network) • Meteorological stations • Automated shore stations • Manual shore station • Boat based programs • Moorings + bouys • Gliders • Remote Sensing • Data Assimilation Modeling • Data Base Development and Management
Meteorological stations • along the coast • provide wind speed, wind direction, air temperature, relative humidity, barometric pressure, solar radiation, rainfall and water temperature data • coastal circulation, upwelling and changes to the weather and climate
Remote Sensing • OCM, MODIS, and GOES satellites for ocean color products • chlorophyll and turbidity, sea surface temperature, and atmospheric conditions
Automated shore stations • suite of sensors at piers along the California coast • automated sensors measure temperature, salinity, chlorophyll, turbidity and water level • local and regional information on mixing and upwelling, land run-off, and algal blooms.
Cast data integration program • snapshots of regional conditions at the time data are collected • boat based programs sample physical, chemical and biological properties of the ocean • using instruments that are mounted to the ship or are deployed overboard at specific stations • discrete samples – provide fine scale data • ongoing series of cruises (CalCOFI) are invaluable for analysis of seasonal, interannual or long term changes in the ocean ecosystem. • Bight Water Quality Data (Central Bight Water Quality Working Group) • 217 sites in the Los Angeles and Santa Barbara region • Temperature, Salinity, Density, Chlorophyll, Coliforms, and E. Coli displayed and available for download. • Point Loma & South Bay Ocean Outfall Permit Programs (City of San Diego) • 181 sites in the San Diego region • Temperature, Salinity, Density, Chlorophyll, and Coliforms displayed and available for download. Captain
Manual shore station - SCCOOS Water Quality • Project involves 6 Health Agencies • Encompasses 525 shoreline stations • Regular monthly and/or weekly updates • Ingests AB411 state mandated shoreline monitoring
Moorings + Buoys • several packages of automated sensors which are spaced throughout the water column • Measure water temperature, salinity, turbidity, chlorophyll, nutrients, speed and direction of currents • data is used in model forecasts, as well as in analysis of long term ocean trends.
Coastal Ocean Current Mapping (HF Radar Network) • Specific length radio waves reflect off of the ocean surface • infer the speed and direction of ocean surface currents (to 1 meter’s depth) • Transmit antenna – ocean surface - receive antenna
Coastal Ocean Current Mapping (HF Radar Network) • surface waves - half of the radar wavelength to be reflected back to the radar system • Doppler shift – twd or away from the radar • For true direction and velocity of surface waves, at least 2 radars needed
Tracking plumes in time HF Radar and Modeling
Tracking plumes in time HF Radar and Satellite Remote Sensing
Gliders • Vertical movement – fish bladder concept • Horizontal movement - wings • Control - Rudder or changing the center of the mass • Two way communication (real time) • Movement – pre-setup coordinates • Low speed • low energy cost – long deployment • Seaglider (UW), Spray (Scripps) & Slocum (Webb)
Gliders • Measurements: • Scattering • Particle abundance and size • Fluorescence channels • Chlorophyll (~ primary production, algae) • Colored Dissolved Organic Matter(important for runoff and effluent plumes) • Phycoerythrin / Rhodamine WT • Temperature, Salinity and Depth (CTD)
A B C D
Integrated Modeling and Observations Center for Integrated Networked Aquatic Platforms (CINAPS) http://cinaps.usc.edu
SCCOOS HAB COASTAL SURVEILLANCE PROGRAM • Automated Pier Stations • T, S, Chl. Fluor. • Group time series (weekly) • Nutrients, Chlorophyll, HAB Species, DA analysis • Glider monitoring • San Pedro Bay • Remote sensing imager of ocean color
HAB’s monitoring Caron lab, USC
Huntington Beach Study – Sept-Oct 2006 (HB06) Collaborative, interdisciplinary, multiscale effort to: • Monitor • Predict • Understand • Provide real-time availability of nearshore coastal observations relevant to managerial decision making
Surf Zone (UCSD) Moorings (USGS, OCSD, UCSD) Drifters (UCSB) AUVs – REMUS (CPSLO) AUVs – Gliders (CPSLO, UCSD) HF Radar (USC, UCSD) Numerical Models (UCLA, JPL) Meteorology (JPL) Dye Studies (UCSD, USC, OCSD) Microbiology (OCSD) Biology (USC, UCSD, CPSLO) Components
Surf Zone T, S, currents Surf Zone Array Surf Zone Drifters Surf Zone Tripods Surf zone mapping, dye studies, drifters
So what are the advantages of using real-time data in the classroom? National Assessment of Educational Progress (NAEP) Science findings of 2000, which revealed a statistically significant increase in scores of those students who downloaded and analyzed data, there also exists compelling evidence that this approach to science instruction improves standardized test scores (National Center for Education Statistics, 2001). Furthermore, in a review of studies on problem solving, it was concluded good problem solvers work harder than poor problem solvers. Most studies of thinking find that problem solvers need to be conscious of their own reasoning processes by talking or writing down their thoughts (Lockhead 1981). Taken from.. http://marine.rutgers.edu/outreach/...
Classroom ocean observatory station • Currents • HF radar, meteorological stations, winds • Coastal pollution • HF radar, models, rainfall, satellite imagery • Food webs, fishy!! • Satellite imagery, automatic stations