Download
1 / 61
620 likes | 898 Vues
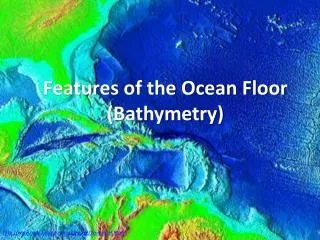
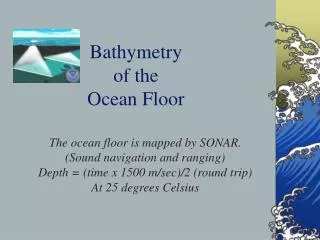
Bathymetry of the Ocean Floor. Bathymetry= measuring ocean depths and charting the shape or topography of the ocean floor “Sounding” lines (started in 85 B.C.) echo soundings (1920’s) ocean was not deepest in the center . Echo sounding- not always accurate. Fig. 4-2a, p. 79.

E N D
Bathymetry of the Ocean Floor • Bathymetry= measuring ocean depths and charting the shape or topography of the ocean floor • “Sounding” lines (started in 85 B.C.) • echo soundings (1920’s) • ocean was not deepest in the center
Echo sounding- not always accurate Fig. 4-2a, p. 79
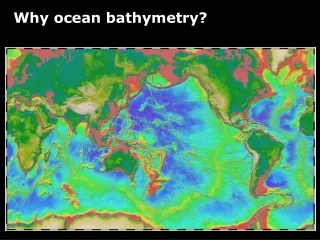
Satellites Can Be Used to Map Seabed Contours With the use of satellite altimetry, sea surface levels can be measured more accurately, showing sea surface distortion. (left) Distortion of the sea surface above a seabed feature occurs when the extra gravitational attraction of the feature “pulls” water toward it from the sides, forming a mound of water over itself.
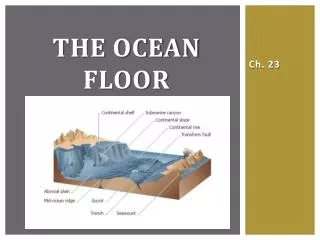
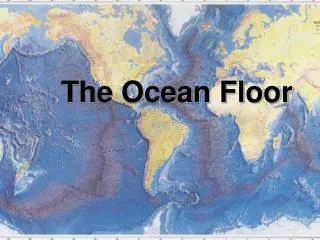
Shape of the Ocean Floor • shallow extensions of the continents extended seaward underwater
Shape of the Ocean Floor • Submerged outer edge of the continents are called continental margins • Deep-sea floor beyond these is called the ocean basin
Continental Margins • Passive margins – • continental margins not located on plate boundaries • Atlantic-type margins
Continental Margins • Active margins- • continental margins on the edge of convergent or transform plate boundaries • Pacific-type margins
Continental Margins • Continental Shelves • Shallow, submerged extension of a continent • broad, gently sloping
Continental Margins • Average width of Continental Shelf is about 70 km (43 miles) • Varies from 10s of m to 1500 km • Width of Continental Shelf is determined by : • proximity to a plate boundary • current speed in the region • sea-level
Continental Margins • Shelf break – • transition between the continental shelf and the continental slope • Occurs at about 140m (360 ft) • Continental Slopes • Steeper than the shelf • Average slope= about 4 degrees (but varies from 1 to 25 degrees)
Continental Margins • Continental rises • base of continental slope covered by a blanket of accumulated sediment • gradual slope • on Passive margins only
Continental Margins • Submarine Canyons • cut into the continental shelf and slope • formed by turbidity currents (avalanche-like sediment movements)
Submarine Canyon Off of The coast Of New Jersey
Ocean Basin • thick layer of sediment (up to 5 km or 3mi thick) covering basaltic rocks • Make up more than ½ of the earth’s surface
Ocean Basin • Oceanic ridges • Underwater mountain chain • an active spreading center • Central rift valley • offset at regular intervals by transform faults
Ocean Basin • Hydrothermal vents • 1977 Robert Ballard & J F Grassle • average temp is about 8-16oC (46-61oF) much warmer than the typical 3-4oC (37-39oF) • support a unique community of organisms that depend on chemosynthetic bacteria