Download
1 / 15
160 likes | 841 Vues
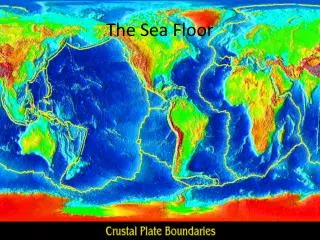
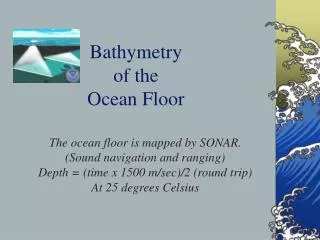
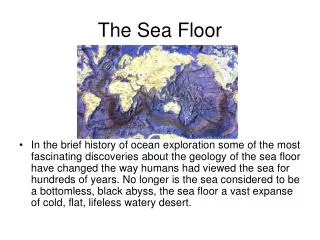
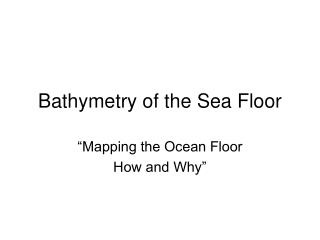
Bathymetry of the Sea Floor. “Mapping the Ocean Floor How and Why” . abyssal plain isolume (lines of equal light) bathymetry (bathymetric) isometric (lines of equal measure) continental shelf isotherm (lines of equal temperature) continental slope mid-ocean ridge

E N D
Bathymetry of the Sea Floor “Mapping the Ocean Floor How and Why”
abyssal plain isolume (lines of equal light) bathymetry (bathymetric) isometric (lines of equal measure) continental shelf isotherm (lines of equal temperature) continental slope mid-ocean ridge contour lines (lines of equal height) profile guyot seamount isobar (lines of equal pressure) topographic map isobath (lines of equal depth) trench isohaline (lines of equal salinity) Terminology
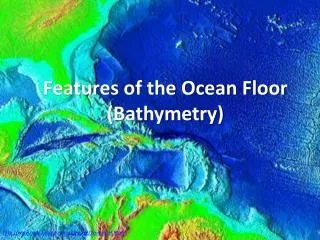
Topography in the Oceans? “Topography can be used to identify and characterize deep water features of the seafloor to reveal upwelling-producing canyons, ridges, and escarpments. Digital data can be correlated with sea surface temperature and chlorophyll, and distribution of marine birds, mammals, and fishes/invertebrates.” – NOAA Bathymetry California
Purposes for Bathymetry • Determine the bottom depth and contour these depths for bottom analysis • Determine topographic features by looking from the top down and bottom geomorphology • Detail physical factors including water current, sediment transport, slope and areas for layering, etc… • Use values for comparisons of changing bottom features and movement of sediments
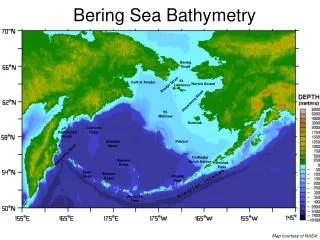
Application Alert Chesapeake Bay “The deepest parts of the Chesapeake Bay and its estuaries may represent a natural barrier to cross-channel sediment transport. This map was developed as a starting point to assist in modeling sediment transport in the Bay”.
http://www.earthguide.ucsd.edu/earthguide/diagrams/sonar/sonar.htmlhttp://www.earthguide.ucsd.edu/earthguide/diagrams/sonar/sonar.html Technologies have evolved to more accurately survey the ocean floor
Using echo sounding to determine depth Measuring water depth: Echosounding Test your knowledge If a sound pulse takes 2 seconds to travel to the seafloor and return to the ship, what is the depth to the seafloor? (Use 1500 m/sec as the speed of sound).
By Nancy J. Hornewer and Marilyn E. Flynn 2008 USGS Project at Upper Lake Mary, Arizona