Mapping the Sea Floor
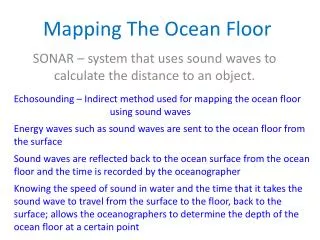
Mapping the Sea Floor. Using Proportion and Scale Drawings. Why map the seafloor?. To help ships and boaters know how deep the water is. To help them avoid running into dangerous objects underwater.

Mapping the Sea Floor
E N D
Presentation Transcript
Mapping the Sea Floor Using Proportion and Scale Drawings
Why map the seafloor? • To help ships and boaters know how deep the water is. • To help them avoid running into dangerous objects underwater. • Ships bring us most of the things we buy, and carry passengers to other places. We want to make sure that ship can safely cross the ocean.
How Did We Map the Sea Floor in the Past? The first survey to map the sea floor in the United States was completed in 1834 on the south shore of Long Island, New York. It was done using lead lines and sounding poles
Lead lines were ropes with numbers marked along them, like a ruler. A lead weight was attached at the end. Sounding poles were like big rulers.
How did this work? A surveyor lowered a line into the ocean. When it hit the bottom, he marked the measurement and pulled it up. He wrote down measurements from different parts of the ocean. Then he put them on a chart to create a “picture” of the ocean floor. This is what your team will be doing!
The measurements were often right, but the uncharted spaces between them were really big. Many objects were missed. Some were rocks as big as your house! These objects caused many shipwrecks.
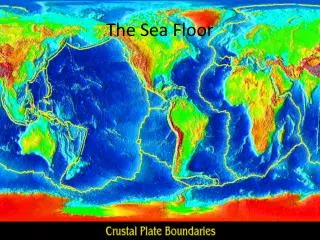
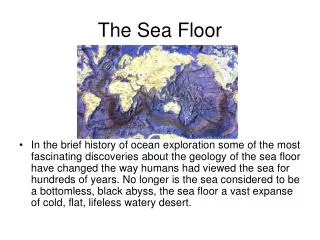
How do we map the ocean floor today? Today scientists use sonar mapping. They use computer mapping software to turn sonar echoes or soundings into rainbow-colored maps. On the right is an example of a rainbow sonar image. Your team will make a rainbow image of your ocean floor mapping.
In this 10-second video, a survey ship measures the depth of the sea floor. These measurements are then used to create rainbow-colored maps. In general, red is used to show shallow depths and blue or purple for deeper depths. Can you see the shallowest point the ship surveyed? http://oceanservice.noaa.gov/education/seafloor-mapping/how_multibeamsonar.html
Prepare a Color Coded Depth Scale Get your “Color Coded Depth Scale” ready: color each grid that is next to a number in a different color of your choice. Example: #1 – Red, #2 – Orange, etc.