Download
1 / 53
530 likes | 695 Vues
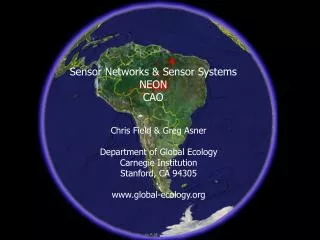
Sensor Networks & Sensor Systems NEON CAO. Chris Field & Greg Asner Department of Global Ecology Carnegie Institution Stanford, CA 94305 www.global-ecology.org.

E N D
Sensor Networks & Sensor Systems NEON CAO Chris Field & Greg Asner Department of Global Ecology Carnegie Institution Stanford, CA 94305 www.global-ecology.org
NEON: a continental scale ecological observation platformUnderstanding and forecasting the impacts of climate change, land use change on continental-scale ecology
NEON Science Vision Provide the capacity to forecast future states of continental-scale ecological systems for the advancement of science and the benefit of society.
NEON Education Vision Prepare society and the scientific community to use NEON data, information, and forecasts in order to understand and effectively manage Grand Challenge ecological issues.
NEON Fundamental Science ChallengesChallenge #1 How will ecosystems and their components respond to changes in natural- and human-induced forcings spatial and temporal scales? And, what is the pace and pattern of the responses?
NEON Fundamental Science ChallengesChallenge #2 How do the internal responses and feedbacks of biogeochemistry, biodiversity, hydroecology and biotic structure and function interact with changes in climate, land use, and invasive species?
Grand Challenge Areas in the Environmental Sciences • Biodiversity • Biogeochemical cycles • Climate change • Hydroecology • Infectious disease • Invasive species • Land use
Developing the NEON strategy • What to measure? • How to make the measurements? • How to scale? • How to synthesize? • How to move from analysis to forecasting?
Derivation of quantitative requirements: Spatial stratification and scaling strategy
Spatial Scaling Strategy Ecological Forecast models LUAP AOP Sites/Exps
Hargrove representativeness analysis within NEON domains red=soil/landform; green= current veg; blue=climate 20% of full resolution Water bodies masked to black G. Henebry 1/25/2007
Derivation of quantitative measurement requirements by Observing System Simulation Hanta flux PAR
NEON Facilities for Science and Education • 20 Core sites (FIU and FSU) • 40 Relocatable sites (FIU and FSU) • 18 Mobile laboratories • 2 Airborne Observing Packages • 10 STREON experiments • 4-5 Global change experiment sites • Land Use Analysis Package • QA/QC Lab • Data and forecast product production facility
Mapping of Grand Challenge Areas to Network Design • D01-D20: Domains 1-20 • E1 = STREON Experiment • E2 = Global Change Experiment
Mapping of Grand Challenge Areas to Network Design: Core Sites = addressed by Core sites. = not addressed • D01-D20: Domains 1-20 • E1 = STREON Experiment • E2 = Global Change Experiment
Mapping of Grand Challenge Areas to Network Design: Relocatables = addressed by relocatable systems • D01-D20: Domains 1-20 • E1 = STREON Eperiment • E2 = Global Change Eperiment
Mapping of Grand Challenge Areas to Network Design: Experiments = addressed by national experiments • D01-D20: Domains 1-20 • E1 = STREON Experiment • E2 = Global Change Experiment
NEON Budget NEON budget still being negotiated with NSF and Congress. Construction budget will be $250-300 million over ten years MREFC account. M&O: ~ 15% of construction 12 million in MREFC dollars are currently appropriated for NEON
Maintenance and Operations Research NEON Timeline Planning plus R&D Construction - MREFC
The Need for Regional-scale Observations • Access to impacts of land-use and climate change • At a spatial scale compatible with high accuracy, and with sensitivity to a wide range of drivers, plus direct and indirect responses • Aircraft measurements very inexpensive, relative to satellites • Aircraft platforms simple to maintain and upgrade • Ironically, US governmental support has been waning, even as the opportunities incease
Evolution of ecological remote sensing systems -- hyperspectral NOAA Landsat ETM+ Land Cover High Resolution Land Cover Landsat TM Landsat MSS Land Cover Satellite Multispectral Sensing Land Cover 1970s 1980s 1990s 2000s 2010s Global Physiology TIROS Global Physiology NASA EOS Global Physiology NOAA High-fidelity imaging spectroscopy Ecosystem Chemistry Low-fidelity Early Ecosystem Chemistry Aircraft Full Spectral Sensing 1970s 1980s 1990s 2000s 2010s
Passive Remote Sensing Basics From 1970s to present, satellites only take a sample of these reflectance ‘signatures’. Now we can see the entire signature…
Canopy Chemistry Invasive Species Myrica invasion front (high leaf nitrogen) Myrica infestations (high leaf nitrogen and high canopy water) Kilauea Caldera Hedychium in forest understory(high canopy water)
Carnegie Invasive Species Program in Hawaii Myrica faya Hedychium Psidium cattleianum Miconia calvensens African grasses
Evolution of ecological remote sensing systems – hyperspectral plus LIDAR NOAA Landsat ETM+ Land Cover High Resolution Land Cover Landsat TM Landsat MSS Land Cover Satellite Multispectral Sensing Land Cover 1970s 1980s 1990s 2000s 2010s Global Physiology TIROS Global Physiology NASA EOS Global Physiology NOAA High-fidelity imaging spectroscopy Ecosystem Chemistry Low-fidelity Early Ecosystem Chemistry Aircraft Full Spectral Sensing and Laser 1970s 1980s 1990s 2000s 2010s Ecosystem Structure LIDAR
The Carnegie Airborne Observatory Laser Detection and Ranging (LIDAR) + Imaging Spectroscopy What does this system deliver? Detailed chemical, structural and biological information on ecosystem health on land and in coastal environments, and at a spatial resolution commensurate with conservation, management, and planning
Spectrometer + LIDAR In-flight Data Fusion Hilo, Hawai’i 0.5 m spatial resolution, full-waveform, 70,000 hz
Example CAO LiDAR waveforms for forest canopy profiling and forest floor detection Subset image of waveform height (m) Sample waveforms Single tree crown (30-60 waveforms)
CAO Instrument Sensor Head Assembly
3-D Forest and Topographic Imaging – Rainforest and cattle pasture, Laupahoehoe Forest Reserve 1.0 m spatial resolution, 100,000 htz
Spectrometer – 1/3 of swath, 1.0 m spatial resolution, 7 nm spectral resolution
Spectrometer – 1/3 of swath, 1.0 m spatial resolution, canopy carotenoid pigments
Spectrometer + LIDAR In-flight Data Fusion Laupahoehoe Forest Reserve, Hawai’i 1.0 m spatial resolution Canopy pigment retrieval at sub-tree crown spatial resolution