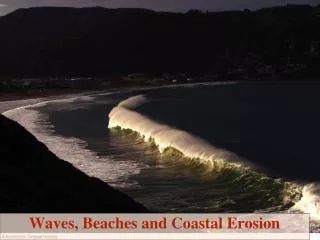
Cyberinfrastructure Application in Coastal Erosion
360 likes | 550 Vues
Cyberinfrastructure Application in Coastal Erosion. Xutong Niu Mapping and GIS Lab http://shoreline.eng.ohio-state.edu October 12, 2006. Outline. Review of coastal research in Mapping and GIS Lab Proposed work in the proposal Preliminary research plan in the first year.

Cyberinfrastructure Application in Coastal Erosion
E N D
Presentation Transcript
Cyberinfrastructure Applicationin Coastal Erosion Xutong Niu Mapping and GIS Lab http://shoreline.eng.ohio-state.edu October 12, 2006
Outline • Review of coastal research in Mapping and GIS Lab • Proposed work in the proposal • Preliminary research plan in the first year
Review of Coastal Research • Coastal Data Integration • Coastal Mapping and Monitoring • Coastal Erosion Modeling
Coastal Data Integration • Coastal Data • Water level • Water gauge • Water surfaces (GLFS) • Satellite altimetry • Bathymetry • Historical shorelines (2D and 3D) • DEMs and orthophotos • USGS • Aearial photographs • Satellite imagery • ……
Water Level • Water Gauge http://co-ops.nos.noaa.gov
Water Level • Water surfaces (GLFS) GLFS Hindcast Mean Water Surface1999-2001
Shorelines • 2D shoreline (x, y) • USGS DLG (Digital Line Graph) • Historical orthophoto • 3D shoreline (x, y, z) • Derive from stereo images
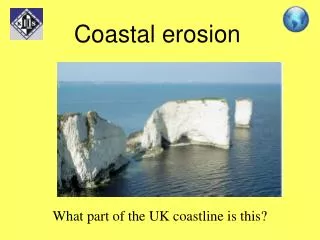
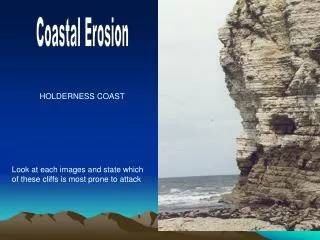
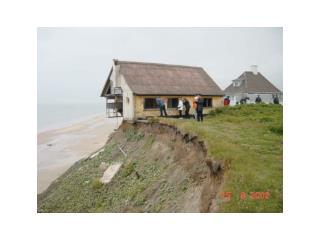
Shorelines (bluff lines) Picture is from http://local.live.com
DEMs and Orthophotos DEM Generated from IKONOS Stereo Images 3D Shoreline Extracted from IKONOS Stereo Images LiDAR DEM at Painesville
Integration of Coastal Data • Problems • Data from Multiple sensors and models: • satellite imagery and altimetry, aerial photos, LiDAR, water gauge, and water surfaces • Formats: • Vector, raster, tabular. • Resolution and accuracy: • centimeter – sub-meter – meters – kilometers • Reference system (horizontal and vertical) • Different Coordinate Systems (State plane, UTM, Latitude and Longitude) • Ellipsoids and Geoids
Integration of Coastal Data • Research work • Datum conversion system • Multi-sensor image integration • Integration of water gauge, water surface, and satellite altimetry • Integration of 3D shoreline, bathymetry, gauge station, and water surface
HTv2.0 3D Helmert Transformation VERTCON NADCON GEOID99 IGLD85 Datum Conversion System Diagram of Datum Conversion in Lake Erie
Geometric Processing of IKONOS Imagery Checkpoint Checkpoint ControlPoints Control Points Use Rational functions (RF): The following two methods are used to improve the RF accuracy: 1-Refine the RF coefficients using ground control points 2-Transfer the derived coordinates from the vendor-provided RF coefficients using ground control points
Forward and Backward QuickBird Forward and Backward IKONOS Backward IKONOS and Backward QuickBird Forward IKONOS and Backward QuickBird Forward QuickBird and Forward IKONOS Forward QuickBird and Backward IKONOS Multi-sensor Image Integration
Integration of Multi-Sensor Images (Methodology) VCP: Virtual control points GCP: Ground control points RPC: Rational polynomial coefficients CKP: Check points
IntegrationofMulti-SensorImages (Results from use of IKONOS, QuickBird, and Aerial Images) Results obtained from integration of all the images
Bluffline Extraction by Integration ofLiDAR and Orthophotos Bluffline extraction (Liu et al. 2005) LiDAR DSM LiDAR Profile Initial Bluffline from LiDAR (bluff top and toe) Iterative Closest Points (ICP) Algorithm for Bluffline Refinement Orthophotos Bluffline Extraction
Bluffline Extraction by Integration ofLiDAR and Orthophotos Results in Test Region 2 Results in Test Region 1
Integration of water gauge, water surface, and satellite altimetry Yearly Comparisons (1999 – 2001) between Altimetry and WSM Comparison between water gauge data and GLFS water surface
IKONOS Shoreline QuickBird Shoreline Tampa Bay, FL Integration of LiDAR Bathymetry, Water Gauge Data and 3-D Shorelines
GPS Satellite Shoreline Erosion Awareness Subsystem Computer PDA Internet Cell phone Coastal Structure Permit Subsystem On-site Mobile Spatial Subsystem Computer Computer Lake Erie Server Coastal Mobile GIS
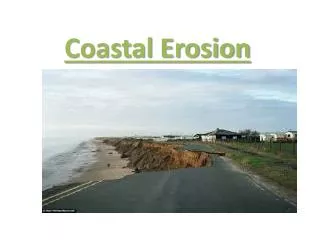
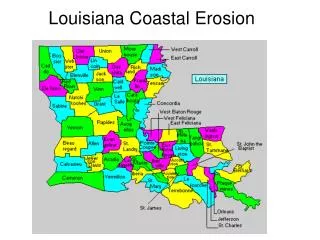
Coastal Erosion Area Maps for Lake County by Ohio Division of Natural Resources
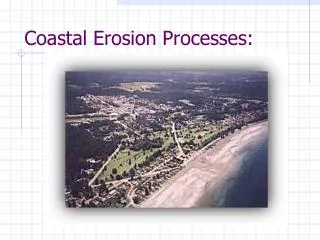
Establishing correspondence This mathematical model can be envisioned as a similarity transformation that transforms the shoreline segment Sm,(k-1)at time (k-1) to the segment Sm,k at time k by the action of the erosion
Mathematical Model Using polynomial Flow chart for model
Error analysis diagram Based on transects digitized from the Coastal Erosion Area map Analysis diagram for shorelines of year 2000
Instantaneous shoreline at time t1 Instantaneous shoreline at time t3 Instantaneous shoreline at time t2 t1 < t2 < …… < tm External force f(X, Y, Z)t1 Tide-coordinated shoreline Pi F(X, Y, Z) Tide gauges f(X, Y, Z)t3 t1 Protection structure f(X, Y, Z)t2 MLLW t3 t2 Snake-based Tide-coordinated Shoreline Model Minimize Energy Function: • Constraints: • Water Surface, Gauge Stations, and Coastal Structures
Snake-based Shoreline Model(Model Equations) Energy Function: Internal Energy: External Energy: Constraints: Water Surface Model Gauge Stations Coastal Structures Evolution Function: External Forces
Initial line Results line Historical lines Experimental Results of the Shoreline Model • Experiment 1 (WSM constraint) • Simulated Shorelines • straight line segments • Simulated WSM • flat plane • Different Initial Positions • Case 2 • Case 1 • Experiment 2 (WSM constraint) • Simulated Shorelines • straight line segments • Real WSM • Different Initial Positions • Case 2 • Case 1
Experimental Results of the Shoreline Model • Experiment 3 (WSM constraint) • Real Shorelines • historical Lake Erie shoreline • Real WSM • Different Initial Positions Water Land
Proposed Work in Proposal • 3.1 Multi-Model Multi-Sensor Data Integration Service • Universal spatial data transfer and conversion service • Convert spatial data to GML to transfer them between GRID nodes • Multi-model Integration Service (Dr. Bedford) • Multi-sensor 3-D Mapping Service • Application services with distributed data • 3.2 Querying Service • Coastal data repository in Mapping and GIS lab. • Provide data access • Metadata indexing (Hakan) • 4.2 Coastal Erosion Prediction and Analysis • Suggested area: Painesville, OH • Conduct coastal erosion pattern analysis • Create an application service
Preliminary Research Plan • In Proposal: “We will investigate different coastal data formats, integrate them with the virtual and wrapper middleware systemand finish the development of multi- data/model integration services, query services, and scalable data mining services. We will also implement time-series analysis algorithms for forecasting and nowcasting application.” • Working in Mapping and GIS Lab • Coastal data format conversion • Integration with the virtual and wrapper middleware system • Multi-sensor integration service