Simulating Ocean Water
Simulating Ocean Water. By Jerry Tessendorf Kwang Hee Ko (modified from the slides by Seo, Myoung Kook). Introduce. Introduce. Introduction. clouds. air. water. glitter. Introduction. Introduce. Focus on algorithms and practical steps to building height fields for ocean waves.

Simulating Ocean Water
E N D
Presentation Transcript
Simulating Ocean Water By Jerry Tessendorf Kwang Hee Ko (modified from the slides by Seo, Myoung Kook)
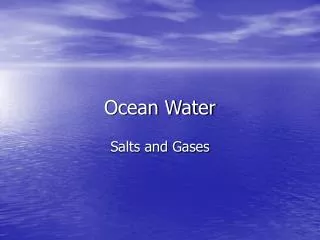
Introduction clouds air water glitter
Introduction Introduce • Focus on algorithms and practical steps to building height fields for ocean waves. • Gerstner Waves (Gravity Waves): linear waves • FFT based method: statistical approach
Introduction • Fluid Dynamics Revisited.... • To describe the velocity, density, pressure of fluid… • Lagrangian description • Eulerian description • In fluid mechanics/dynamics, the Eulerian description method is widely used.
Mass Conservation • Mass conservation is applied to an infinitesimal region -> Continuity Equation
Momentum Conservation • Momentum Conservation
Equations • Force Equation • Mass Conservation • Solve for functions of space and time: • 3 velocity components u =(u,v,w) • Pressure(p) • density (ρ) distribution
Application to Surface Waves • Limitation • single sine wave horizontally and vertically • a more complex profile by summing a set of sine waves
Statistical Wave Models • To simulate realistic waves in the ocean, we can use statistical models in combination with experimental observations. • The wave height is considered a random variable of horizontal position and time, h(x,t). • The wave height field is decomposed as a sum of sine and cosine waves. • The amplitudes of the waves have nice mathematical and statistical properties, making it simpler to build models. • Computationally, the decomposition uses FFTs.
Statistical Wave Models • The fft-based representation of a wave height field expresses the wave height h(x,t) at the horizontal position x=(x,z) as the sum of sinusoids with complex, time-dependent amplitudes: • ĥ is the height amplitude Fourier component, which determines the structure of the surface.
Statistical Wave Models • In computer graphics, we need to compute the slope vector of the wave height field • to find the surface normal • to find the angle of incidence, etc. • An exact computation of the slope vector can be obtained by using more ffts: • Slope computation via the fft in equation 20 is the preferred method.
Statistical Wave Models • The fft representation produces waves on a patch with horizontal dimensions Lx X Lz. • Outside the patch the wave surface is perfectly periodic. • The patch can be tiled seamlessly over an area. • The consequence of such a tiled extension is that an artificial periodicity in the wave field is present. • As long as the patch size is large compared to the field of view, this periodicity is unnoticeable.
Statistical Wave Models • In practice, equation 19 is enough to model the ocean waves. • The amplitudes ĥ(k,t) are nearly statistically stationary, independent, gaussian fluctuation with a spatial spectrum. Ph(k) = <|ĥ(k,t)|2>, <> denotes the ensemble average. • We can find an empirical model of Ph(k) • A useful model for wind-driven waves larger than capillary waves in a fully developed sea: the Phillips spectrum. - L=V2/g is the largest possible waves from a continuous wind of speed V. - ω is the direction of the wind.
Statistical Wave Models • To realize the waves • We sample Ph(k) in a random manner and compute the ĥ(k,t) using the following equation • Then use the following to create the Fourier amplitudes of the wave field realization at time t ξ’s are ordinary independent draws from a gaussian random number generator, with mean 0 and standard deviation 1. Propagating waves to the left and to the right Realizations of the wave height field
Examples A surface wave height realization , displayed in greyscale. • The reflectivity of the water is a strong function of the slope of the waves, as well as the directions of the light(s) and camera. • The visible qualities of the surface structure tend to be strongly influenced by the slope of the waves. The x-component of the slope for the wave height realization
Variation in Wave Height Field • Increasing directional dependence Modified Phillips Spectrum Pure Phillips Spectrum
Effect of Resolution • varying the size of the grid numbers M and N • the facet sizes dx and dz proportional to 1/M and 1/N.