How To Track OEE
150 likes | 198 Vues
Know here about some expert tips for calculating OEE and it's improvement are revealed here. Know how to increase OEE value and improve the productivity of your manufacturing plant. www.downtimecollectionsolutions.com

How To Track OEE
E N D
Presentation Transcript
Your Guide for Tracking Overall Equipment Effectiveness How To Track OEE Thrive - Efficiency Realized
It can be very difficult (near impossible!) to keep track of every action and problem on the production floor. This is where OEE monitoring comes into play. With OEE systems, you will be able to identify potential losses and areas for improvement. www.downtimecollectionsolutions.com
It can be very difficult to keep track of every action and problem on the production floor. The most reliable way to monitor machine systems and collect important data is using the OEE metric, or overall equipment effectiveness. Monitoring OEE will help identify any potential losses in your operations and where your processes and strategies could improve.
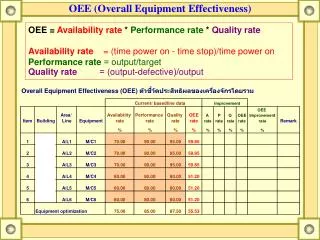
THE BASICS: DEFINING AND CALCULATING At its core, OEE is a metric that measures the efficiency of machines. It is composed of three main ideas: availability, performance, and quality. Availability is defined as the amount of time the machine is actually running compared to the amount of time it was scheduled to run. Availability includes equipment breakdowns and time adjusting or fixing a machine.
Performance consists of the speed that parts are produced while the machine is running. The more that is produced per hour will results in a higher performance percentage. Minor stoppages, slow operations, and machines idling will decrease your performance score. The quality metric measures the percentage of good parts produced out of total parts produced. The main reason for a low quality score is product defects and low percent of good parts produced. Calculating OEE is simple: OEE = Availability x Performance x Quality
Tracking OEE These systems will automatically detect when your machines are running, when they are stopped, and the number of parts each machine produces. This data will be directly sent to a monitoring software that logs every machines data and calculates machines’ OEE. This information is available to operators in real time so you know exactly how each machine is running. Tracking equipment effectiveness has never been easier than with systems that produce automatic, live data! www.downtimecollectionsolutions.com
These systems will show your machines in 1 of 5 different states: Running- Also known as “uptime” which means that the machine is operating and making parts properly! The more often that machines are running, the higher the machines availability percentage. Idle- This is when the machine has stopped but there is no known reason why. Once the system indicates a reason for the machine’s idle state, the status will change to downtime or changeover.
Unplanned Downtime In this state, the machine is stopped and the reason will be reported to operators. Planned Downtime ·The machine is also stopped in this state and the reason has been previously “planned”. Planned downtime does not affect the availability percentage. Changeover The machine is stopped in this state whether it was planned or unplanned downtime. When it is logged as unplanned downtime the OEE availability will be negatively affected.
Know your score 80 As OEE is tracked and monitored, you will need to understand the score your operation is being given. 60 A score of 85% is considered “world class” or “best in class” and is a very achievable goal for any operation. World class performers have high efficiency and productivity in all areas of availability, performance, and quality. 40 20 The most common OEE score is 60% which means that an operation is only productive 60% of the time. 0 Item 1 Item 2 Item 3 Item 4
Laggards are the lowest performers of manufacturers. A score between 30% and 50% indicates extremely low productivity levels which could be caused by downtime or equipment performances.
Understanding these principles of OEE will allow your plant to operate more effectively, consistently. The best possible score is a perfect score of 100%, but that is not a realistic goal for most plants.