Download
1 / 33
330 likes | 478 Vues
MARKETING PLAN. STEP 1 : STRATEGIC MARKET OBJECTIVE INDEXING MARKET ATTRACTIVENESS INDEXING COMPETITIVE POSITION SMO BASED ON “MA & CP”. 1. -67. MA. -33. 0 -33 -67 1. CA. STEP 2 :. SITUATION ANALYSIS. MARKET DEMAND. CUSTOMER ANALYSIS.

E N D
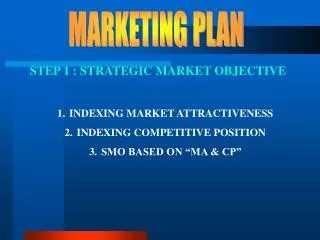
MARKETING PLAN • STEP 1 : STRATEGIC MARKET OBJECTIVE • INDEXING MARKET ATTRACTIVENESS • INDEXING COMPETITIVE POSITION • SMO BASED ON “MA & CP”
1 -67 MA -33 0 -33 -67 1 CA
STEP 2 : SITUATION ANALYSIS MARKET DEMAND CUSTOMER ANALYSIS COMPETITOR ANALYSIS COMPETITOR POSITION PERFORMANCE METRICS SIZE & GROWTH END USERS STRUCTURE MS PRICE/ QUALITY COST/ VALUE SALES CS MARGIN/PROFIT INTER-MEDIARIES GAP ANALYSIS POTENTIAL SUBSTITUTES ENVIRON-MENT NON-CONSUMERS
STEP 3 : KEY PERFORMANCE ISSUES EXAMPLE OF KPI KEY ISSUE (UNDERLYING CAUSE) OBSERVABLE PERFORMANCE (RESULT) • Declining relative product quality due to competitor product improveness • Ineffective communications reach, low frequency & poor branding • W/S not providing needed distributor service & support • Declining • Low awareness of the product & key benefits • Poor product availability with low distributor inventory
PRIORITIZING KEY ISSUES IN ORDER OF IMPACT ON PERFORMANCE MARKET METRIC FINANCIAL METRIC • CUSTOMER AWARENESS • PRODUCT AVAILABILITY • CS • CV • SALES REVENUE • UNIT MARGIN • N M C • NET PROFITS IMPACT PERFORMANCE 1 2 3 4 5 6 7 8 9 10 KEY ISSUES IN ORDER OF PERFORMANCE IMPACT
STEP 4 : MARKETING STRATEGY • DEVELOPMENT • Main Program • Operational program
STEP 5 : RESOURCE ALLOCATION & MRKT BUDGET EXAMPLE KEY ISSUE Low end user availability due to lack of insufficient sales coverage of industrial supply houses MKT STRATEGY A direct channel & sales system with 80 manuft reps & 5 missionary sales people will contract & serve 5000 industrial supply house, approximately 30 % of all supply houses
RESOURCES : Product market mngr $ 200.000 Five missionary sales people 750.000 Distributor literature 100.000 Manufacturer / rep training 100.000 TOTAL Resources needed $ 1.150.000
STEP 6 PERFORMANCE METRICS & IMPACT OF MARKETING PLANS PERFORMANCE IMPACT OF A FINE YEAR MARKETING PLAN
EXTERNAL MARKET METRIC CURRENT Y1 ------ Y5 • Customer awareness - - - • Very satisfied customer - - - • Distributor share - - - • MS - - - • Market demand - - - • Market development index - - - • B. INTERNAL FINANCIAL METRIC • Unit volume - - - • W/S discount - - - • Distributor discount - - - • Net price - - - • SALES REVELUE - - - • COGS - - - • CM - - -
CONTROLLING MARKETING ACTIVITY • THE MAIN FINDINGS • Smaller companies do a poorer job of setting clear objectives & establishing systems to measure performance • Fewer than half of the companies studied their individual products’ profitability • About one third of the companies had no regular review procedures for spotting & deleting weak products • Almost half of the companies failed to compare their prices with competition • Many companies take 4 to 8 weeks to develop control reports, which are occasionally inaccurate
THE CONTROL PROCESS WHAT DO WE WANT TO ACHIEVE ? GOAL SETTING WHAT IS HAPPENING ? PERFORMANCE MEASUREMENT PERFORMACE DIAGNOSIS WHY IS IT HAPPENING ? WHAT SHOULD WE DO ABOUT IT ? CORRECTIVE ACTION “CONTROL PROCESS”
ANNUAL PLAN CONTROL • TOTAL VARIANCE • ( Qa - Ca ) – ( Qp - Cp ) • 2. PRICE / COST QUANTITY • (QaCa – QaCp) + (QaCp - QpCp) • 3. PRICE /COST QUANTITY • Qa (Ca – Cp) + Cp (SaMa – SpMp) • 4. PRICE /COST MARKET SIZE SHARE • Qa (Ca – Cp) + Cp (SpMa – SpMp) + Cp (SaMa – SpMp) • 5. PRICE /COST MARKET SIZE SHARE • Qa (Ca – Cp) + CpSp (Ma - Mp) + CpMa (Sa – Sp)
VARIABLES Q = quantity C = contribution margin S = share M = market LEGEND SUBSCRIPTS a = actual p = planned
ANNUAL PLAN CONTROL • VARIANCE DECOMPOSITION OF MARKET PLAN PERFORMANCE NET MKT CONTRIBUTION MARKET DEMAND = x MS x PRICE/UNIT – VC/UNIT) - (MARKET EXPENSES)
RECOGNIZING THESE MKT PERFORMANCE PARAMETERS, A MKT PLAN REQUIRES THAT THE BUSINESS ESTIMATE A SPECIFIC LEVEL OF : • MARKET DEMAND THE SIZE OF THE TARGET MARKET • MARKET SHARE • PRICE • VARIABLE-COST ALL PRODUCT COST, TRANSPORTATION COST, & SALES COST • MKT EXPENSES
VOLUME VARIANCE Mp x (Va – Vp) MKT EXP VAR MEp – MEa MARGIN VARIANCE Va x (Ma – Mp) DEMAND VARIANCE MpxMSp(MDa-MDp) SHARE VARIANCE MpxMDa(MSa-MSp) PRICE VARIANCE Va (Pa-Pp) COST VARIANCE Va (Cp – Ca)
VOLUME VARIANCE Mp x (Va – Vp) 250 (250K – 250K) MKT EXP VAR MEp – Mea 15 mil – 15 mil MARGIN VARIANCE Va x (Ma – Mp) 250K(250-250) DEMAND VARIANCE MpxMSp(MDa-MDp) 250 x .35(1.25 – 1m) = + $ 15.625 m SHARE VARIANCE MpxMDa(MSa-MSp) 250 x 1.25 m (.20 – 25) = - $ 15.625 m PRICE VARIANCE Va (Pa-Pp) 250 K (460-450) = + $ 2.5 m COST VARIANCE Va (Cp – Ca) 250 K (200 – 210) = + $ 2.5 m
Vp = volume (plan) Va = volume (actual) Pp = price (plan) Pa = price (actual) MDp = market demand (plan) MDa = market demand (actual) Cp = VC plan Ca = VC actual MSp = market share (plan) MSa = market share (actual) Mp = margin (plan) Ma = margin (actual)
ANNUAL PLAN CONTROL • SALES ANALYSIS • Suppose the annual plan • Seling = 4000 unit • Price = $ 1 / unit • Actual selling = 3000 unit • price = $ 80 / unit • Variance due to price decline = ($ 1.00 - $ .80) (3000) = $ 600 37.5 % • Variance due to volume decline = ($ 1.00) (4000.3000) = $ 1000 62,5 % $ 1600 100 % Sales performance variance is $ 1600 or 40 % of expected sales
M/S ANALYSIS • OVERALL M/S • RELATIVE M/S TOP 3 TOP LEADING COMPETITOR
ANALYSIS MARKET SHARE MOVEMENTS IN TERMS OF FOUR COMPONENT OVERALL M/S = CP x CL x CS x PS • CP = Customer Penetration • = % ….. All customer • CL = Customer Loyalty • = Purchases from the Co by its cust • Total ……. From all suppliers • CS = Customer selectivity • = Size of the average customer purchase from the co • Size of the average cust purchase from an average company • Price Selectivity • = average price changed by the co • average price changed by all co
MARKET BASED SCORECARD ANALYSIS • Customer performance scorecard • - New customers • - Dissatisfied customers • - Lost customers • - target market awareness • - relative product quality • - relative service quality
III. EFFICIENCY CONTROL 1. ADVERTISING • Biaya iklan per 1000 pembeli sasaran yang dijangkau media • % audiens yang memperhatikan, melihat/menghubungkan, dan membaca sebagian besar iklan cetakannya • Pendapat konsumen atas isi dan efektivitas iklan • Ukuran sebelum-stealth atas sikap terhadap produk • Jumlah pertanyaan yang ditimbulkan iklan tsb • Biaya per pertanyaan (cost per inquiry)
2. SALES FORCE EFFICIENCY • Average number of calls per sales person per day • Average sales call time per contact • Average revenue per sales call • Average cost per sales call • Entertainment cost per sales call • Percentage of orders per 100 sales calls • Number of new customer per period • Number of lost customer per period • Sales force cost as a percentage of total sales
STRATEGY CONTROL • THE MKT EFFECTIVENES REVIEW • CUSTOMER PHILOSOPHY • INTEGRATED MKT ORGANIZATION • ADEQUATE MKT INFORMATION • STRATEGIC ORIENTATION • OPERATIONAL EFFICIENCY
MARKETING AUDIT • MARKETING ENVRONMENT AUDIT • MARKETING STRATEGY AUDIT • MARKETING ORGANIZATION AUDIT • MARKETING SYSTEM AUDIT • MARKETING PRODUCTIVITY AUDIT • MARKETING FUNCTION AUDIT
P O O R • Product driven • Mass marketed oriented • Product offer • Average product quality • Average service quality • End-product oriented • Function oriented • Reacting to competitors • Supplier exploitation • Dealer exploitation 11. Price driven 12. Average speed 13. Hierarchy 14. Vertically integrated 15. Stockholder driven
G O O D • Market driven • Segment oriented • Augmented product offer • Better than average • Better than average • Core-product oriented • Process oriented • Benchmarking competitors • Supplier preference • Dealer support • Quality driven • Better than average • Network • Flattened organization • Stakeholder driven
EXCELLENT • Market driving • Niche oriented & customer • Customer solution offer • Legendary • Legendary • Core-competency-oriented • Outcome-oriented • Leapfrogging competitors • Supplier partnership • Dealer partnership • Value driven • Legendary • Team work • Strategic Alliances • Societally driven