Download
1 / 42
420 likes | 531 Vues
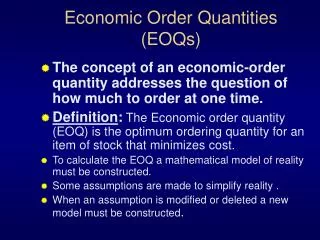
This chapter discusses the complexities of inventory management, focusing on order quantities when demand is stable. It covers various costs associated with inventory, including product costs, ordering costs, holding costs, and the impacts of shortages and shrinkage. The chapter introduces concepts such as ABC analysis, Economic Order Quantity (EOQ), and sensitivity analysis, highlighting their importance in minimizing total inventory costs. Practical insights and strategies are presented to enhance ordering efficiency and inventory control in various retail environments.

E N D
Order Quantities when Demand is Approximately Level Chapter 5 Inventory Management Dr. Ron Tibben-Lembke
Inventory Costs Costs associated with inventory: • Cost of the products • Cost of ordering • Cost of hanging onto it • Cost of having too much / disposal • Cost of not having enough (shortage)
Shrinkage Costs • How much is stolen? • 2% for discount, dept. stores, hardware, convenience, sporting goods • 3% for toys & hobbies • 1.5% for all else • Where does the missing stuff go? • Employees: 44.5% • Shoplifters: 32.7% • Administrative / paperwork error: 17.5% • Vendor fraud: 5.1%
Inventory Holding Costs Category% of Value Housing (building) cost 6% Material handling 3% Labor cost 3% Opportunity/investment 11% Pilferage/scrap/obsolescence 3% Total Holding Cost 26%
ABC Analysis • Divides on-hand inventory into 3 classes • A class, B class, C class • Basis is usually annual $ volume • $ volume = Annual demand x Unit cost • Policies based on ABC analysis • Develop class A suppliers more • Give tighter physical control of A items • Forecast A items more carefully
Classifying Items as ABC % Annual $ Usage A B C % of Inventory Items
ABC Classification Solution Stock # Vol. Cost $ Vol. % ABC 206 26,000 $ 36 $936,000 105 200 600 120,000 019 2,000 55 110,000 144 20,000 4 80,000 207 7,000 10 70,000 Total 1,316,000
Economic Order Quantity Assumptions • Demand rate is known and constant • No order lead time • Shortages are not allowed • Costs: • A - setup cost per order • v - unit cost • r - holding cost per unit time
EOQ Inventory Level Q* Optimal Order Quantity Decrease Due to Constant Demand Time
EOQ Inventory Level Instantaneous Receipt of Optimal Order Quantity Q* Optimal Order Quantity Time
EOQ Inventory Level Q* Reorder Point (ROP) Time Lead Time
EOQ Inventory Level Q* Average Inventory Q/2 Reorder Point (ROP) Time Lead Time
Total Costs • Average Inventory = Q/2 • Annual Holding costs = rv * Q/2 • # Orders per year = D / Q • Annual Ordering Costs = A * D/Q • Annual Total Costs = Holding + Ordering
How Much to Order? Annual Cost Holding Cost = H * Q/2 Order Quantity
How Much to Order? Annual Cost Ordering Cost = A * D/Q Holding Cost = H * Q/2 Order Quantity
How Much to Order? Total Cost = Holding + Ordering Annual Cost Order Quantity
How Much to Order? Total Cost = Holding + Ordering Annual Cost Optimal Q Order Quantity
Optimal Quantity Total Costs =
Optimal Quantity Total Costs = Take derivative with respect to Q =
Optimal Quantity Total Costs = Take derivative with respect to Q = Set equal to zero
Optimal Quantity Total Costs = Take derivative with respect to Q = Set equal to zero Solve for Q:
Optimal Quantity Total Costs = Take derivative with respect to Q = Set equal to zero Solve for Q:
Optimal Quantity Total Costs = Take derivative with respect to Q = Set equal to zero Solve for Q:
Sensitivity • Suppose we do not order optimal EOQ, but order Q instead, and Q is p percent larger • Q = (1+p) * EOQ • Percentage Cost Penalty given by: • EOQ = 100, Q = 150, so p = 0.5 50*(0.25/1.5) = 8.33 a 8.33% cost increase
A Question: • If the EOQ is based on so many horrible assumptions that are never really true, why is it the most commonly used ordering policy?
Benefits of EOQ • Profit function is very shallow • Even if conditions don’t hold perfectly, profits are close to optimal • Estimated parameters will not throw you off very far
Tabular Aid 5.1 • For A = $3.20 and r = 0.24% • Calculate Dv =total $ usage (or sales) • Find where Dv fits in the table • Use that number of months of supply • D = 200, v = $16, Dv=$3,200 • From table, buy 1 month’s worth • Q = D/12 = 200/12 = 16.7 = 17
How do you get a table? • Decide which T values you want to consider: 1 month, etc. • Use same v and r values for whole table • For each neighboring set of T’s, put them into
How do you get a table? • For example, A = $3.20, r = 0.24 • To find the breakpoint between 0.25 and 0.5 • Dv = 288 * 3.2 / (0.25 * 0.5 * 0.24) • = 921.6 / 0.03 = 30,720 • So if Dv is less than this, use 0.25, more than that, use 0.5 • Find 0.5 and 0.75 breakpoint: • Dv = 288 * 3.2/(0.5 * 0.75 * 0.24) = 10,2240
Why care about a table? • Some simple calculations to get set up • No thinking to figure out lot sizes • Every product with the same ordering cost and holding cost rate can use it • Real benefit - simplified ordering • Every product ordered every 1 or 2 weeks, or every 1, 2, 3, 4, 6, 12 months • Order multiple products on same schedule: • Get volume discounts from suppliers • Save on shipping costs • Savings outweigh small increase from non-EOQ orders
Time Uncoordinated Orders
Simultaneous Orders Time Same T = number months supply allows firm to order at same time, saving freight and ordering expenses Adjusted some T’s, changed order times
Offset Orders Same T = number months supply allows firm to control maximum inventory level by coordinating replenishments With different T, no consistency
Quantity Discounts • How does this all change if price changes depending on order size? • Explicitly consider price:
Discount Example D = 10,000 A = $20 r = 20% Price Quantity EOQ v = 5.00 Q < 500 633 4.50 501-999 666 3.90 Q >= 1000 716
Discount Pricing Total Cost Price 1 Price 2 Price 3 X 633 X 666 X 716 Order Size 500 1,000
Discount Pricing Total Cost Price 1 Price 2 Price 3 X 633 X 666 X 716 Order Size 500 1,000
Discount Example Order 666 at a time: Hold 666/2 * 4.50 * 0.2= $299.70 Order 10,000/666 * 20 = $300.00 Mat’l 10,000*4.50 = $45,000.00 45,599.70 Order 1,000 at a time: Hold 1,000/2 * 3.90 * 0.2= $390.00 Order 10,000/1,000 * 20 = $200.00 Mat’l 10,000*3.90 = $39,000.00 39,590.00
Discount Model 1. Compute EOQ for each price 2. Is EOQ ‘realizeable’? (is Q in range?) If EOQ is too large, use lowest possible value. If too small, ignore. 3. Compute total cost for this quantity 4. Select quantity/price with lowest total cost.
Adding Lead Time • Use same order size • Order before inventory depleted • R = DL where: • D = annual demand rate • L = lead time in years