Download
1 / 17
170 likes | 482 Vues
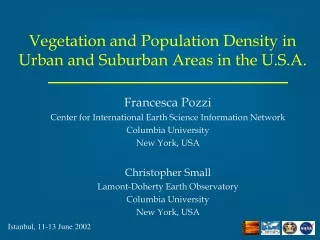
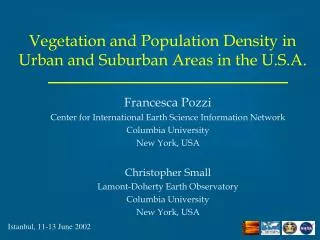
Vegetation and Population Density in Urban and Suburban Areas in the U.S.A. Francesca Pozzi Center for International Earth Science Information Network Columbia University New York, USA Christopher Small Lamont-Doherty Earth Observatory Columbia University New York, USA.

E N D
Vegetation and Population Density in Urban and Suburban Areas in the U.S.A. Francesca Pozzi Center for International Earth Science Information Network Columbia University New York, USA Christopher Small Lamont-Doherty Earth Observatory Columbia University New York, USA Istanbul, 11-13 June 2002
Objectives • Characterize urban areas based on demographic and physical characteristics: • Population Density • Vegetation Abundance • Examine consistency of relationship between the two variables in the USA • Compare with existing land cover classification (USGS) • Can this help us find alternative classification systems for urban areas?
Case Study: The USA • 6 cities with different geographic location, physical environment and urban growth dynamics Atlanta Chicago Los Angeles New York Phoenix Seattle
Data: Population Density • 1990 US Census Bureau population counts at the block level (Spatial and tabular data) • Density in people/km2 • Data reprojected to UTM, • Rasterized to 30 m, • Co-registred to Landsat New York City
Data: Vegetation Abundance • Landsat TM data, circa 1990 • Spectral reflectance of many urban areas can be described as linear mixing of: • Low albedo • High albedo • Vegetation • Linear un-mixing • Fraction images showing areal % of each endmember within each pixel (0 to 1) • Validation with IKONOS, accuracy within 10% Vegetation Fraction (White = 0, Dark Green = 1)
Data: USGS National Land Cover Dataset • Based on Landsat TM data • Nominal-1992 acquisitions • Modified Anderson LULC Classification System • Selected 3 “Developed” classes: • Low Intensity Residential • High Intensity Residential • Commercial/Industrial/Transportation USGS NLCD “Developed” classes (Light orange = LIR, Orange = HIR, Red = CIT)
Analysis • Analysis of population distributions across the entire U.S. • Demographic Classification • Quantification of the relationship between population density and vegetation fraction • Bivariate distributions • Marginal distributions • Comparison with USGS NLCD Classes • Distributions of areal extent of each USGS class as a function of population density and vegetation fraction
Population Density Distribution in the U.S. • Multimodal Distribution • Modes are: • Rural: pop. dens. <100 • Suburban: 100 <pop.dens. < 10,000 • Urban: pop. dens >10,000 people/km2 • Grey line: Western US (west of the 90 ° W) • Black line: Eastern US
Demographic Classification Population Density Example: portion of Chicago 3 Classes of population density Demographic Classification Overlay with vegetation fraction Blue: Rural Green: Suburban Red: Urban Demographic Classification Vegetation Fraction
Bivariate Distributions Distributions of people as functions of Population Density and Vegetation Fraction Legend: warmer colors = higher numbers of people on Log scale
Comparison with USGS NLCD Classes • Distributions of areal extent of each USGS “Developed” class as functions of population density and vegetation fraction • Red: High Intensity Residential • Green: Low Intensity Residential • Blue: Commercial/Industrial/Transportation
Comparison with USGS NLCD Classes • Visual comparison between Demographic Classification and USGS NLCD “Developed” Classes • Legend: • Blue: Rural/CIT • Green: Suburban/LIR • Red: Urban/HIR • Cities: • Top: Chicago • Middle: New York • Bottom: Los Angeles
Conclusions • Population density distribution in the U.S. demographic classification (urban/suburban/rural) • Vegetation cover is the most consistent spectral characteristics in suburban areas • Spectral heterogeneity wide range of vegetation fractions in demographically urban and suburban areas • Not possible to consistently characterize urban and suburban areas in the U.S. based on reflectance characteristics at Landsat resolutions
What next? • Emphasize results on quantitative characterization of vegetation abundance as means to provide physical basis for comparison of urban environments • Explore classification schemes based on spectral heterogeneity at multiple pixel scales, supplemented by auxiliary data sources • Demographic Classification for the year 2000 and urban sprawl analysis
Thank you! fpozzi@ciesin.columbia.edu http://sedac.ciesin.columbia.edu/urban_rs