Download

1 / 57
760 likes | 1.54k Vues
Population distribution and density. Human elective. Population distribution. People spread across the world Distribution is very uneven Places difficult to live include mountains and deserts, places attractive to live places with resources. Population density.

E N D
Population distribution and density Human elective
Population distribution • People spread across the world • Distribution is very uneven • Places difficult to live include mountains and deserts, places attractive to live places with resources
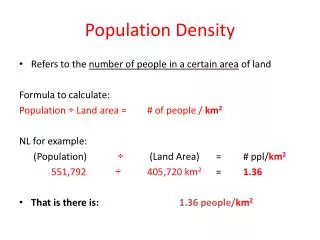
Population density • Average number of people living per sq km • Related to population and the land available • Calculated by dividing the population by the land area • High population density: Java has a population den. Of 5000 per sq km • Low population density: Amazon rainforest has a pop. den. of 3 per sq km
Factors affecting population distribution and density Physical factors: • Climate: • where people live comfortably, crops can grow successfully • 90% of the world pop live in the northern hemisphere temperate zone • Pop den. Highest in the region= long growing seasons ie. Europe and North East USA
Factors affecting population distribution and density Physical factors: 2) Relief: • Flat low-lying areas = high densisties • 80% of pop live in altitudes below 500m • Mountainous regions have low pop den • Building infrastructure easier in flat lands, better communication networks
Factors affecting population distribution and density Physical factors: 3) Soils: • Fertile soils attractive for crops (brown earth soil) • Mountains tend to have poor soils, thin or infertile, discourages living conditions
Factors affecting population distribution and density Physical factors: 4) Drainage: • Areas with rivers more densely populated • Water for farming, industry, to live • Provide fertile soils (alluvial soils) • Transport (River Rhine) • Egypt: 90% of people live within 6km of the Nile
Factors affecting population distribution and density Physical factors: 5) Resources: • Regions with mineral deposits attract industries • Leads to major settlements such as coal mining in the Same Bemuse region
Factors affecting population distribution and density Human factors: • Government: • Regions with stable political systems have higher pop den. ie. Europe since the 2nd world war • Offer peace and justice as well as services • Political conflict zones lead to refugees fleeing lower the population • Government schemes ie. Sponsored resettlement brings people to more sparely populated areas
Factors affecting population distribution and density Human factors: 2) socio-economic: • Economic growth offers job opportunities • Change can be seen in growth ie. Ireland where people move from west-east • Religion: Utah high pop den of Mormons
Factors affecting population distribution and density Human factors: 3) Historic: • Conquest and colonisation ie. Plantations • Events such as the Famine (low pop den)
Population growth • Influenced by birth and death rates, migration • Birth rates: number of live births per thousand of a population • Death rates: number of deaths per thousand of a population • Natural increase: difference between birth and death rates, when birth rates are higher than the death rates • Natural decrease: when death rates are higher than the birth rates
Factors influencing birth and death rates • Education and status of women (social) • Standard of living (economic) • Government policy (social) • Religion, society and customs (cultural)
1. Education & status of women (social factor) • Education allows women to make personal decisions about family size. • More knowledge of health care-healthier children-lower child mortality-no need for more children to support elderly-low birth rate • Better job opportunities-less desire for big family-low birth rate • Older when leave education-fewer fertile years available-fewer children born
2) Standard of living(economic factor) • High standard of living=low birth rates and death rates • Cost of raising a child in Ireland over 8000 per year for the 1st 8 years • Access to clean water and better healthcare • Less developed countries no government support • Large families=economic advantage • High birth rates and death rates due to poor health care and services
3) Government policy(social factor) • China one child policy (1974), importance of boys in society • Romania (1960’s) abortion outlawed, childless people over 25 had to pay extra tax (10-20% of income), allowances for children increased • Russia birth rates low leading the governement to pay families for children (almost 7,000 for 2nd and 3rd child) • Paris Region – extra money for a third child, long maternity leave etc.
4) Religion, society and customs • Catholic influences strong=birth rates higher (South America) due to opposition to contraception and termination • Society place demands: India having sons economic advantage (dowry) • Women encouraged to have more sons to increase family wealth
5) Fertility rates • Total fertility rate: average number of babies born to women during their reproductive years • Influenced by the previous four factors • To replace its population country needs a TFR of 2.1 children per women • Several European countries below this, Ireland currently at this
AIDS • One of biggest threats to life expectancy • In 2007 39,000,000 suffers worldwide • Anti-retroviral drugs prolong life • Drugs too expensive for many 3rd world countries
Patterns in Population Growth • Initial pop low so growth was low • Agriculture started 12,000ya in middle east, asia and europe • Malthus believed natural disaster necessary to keep pop down - Famines, diseases and war kept pop low • Prior to good transport accessibility to food was limited which affect pop growth also • Persecution by local laws contirbuted to deaths of high numbers
1750 world pop began to grow rapidly: • Agricultural Revolution - New farmingmethods & improved technology… crop rotation, better farm machinery, use of seed drill, better animal breeds, all of these increased food production • Industrial Revolution - Invention of steam engine….factories & coalfields developed -- employment, improved income, new housing and dev. of towns, absorbed the increasing working population • Medical Revolution - Improved hygiene & medicine, eliminated diseases, longer & healthier life
These aided the pop explosion over past 60 yrs • Life expectancy from 40 in 1950 to 75 in 2010 and expected to be 82 in 2050 • Stable pop worldwide means 2.1 children per family…. Europe as low as 1.56 but Latin America = 4; Africa = 6 • Industrialisation, increased income, medical & education dev. led to lower death rate and higher pop.
Regional Growth patterns over time & space 1990… 1.2 billion in developed world & 4.1 billion in less dev. Half worlds pop was in east & south Asia… China 1.2 billion & India 960 million. Europe 15% America (N&S) 14% Africa 12% By 2025 Africa's share of world pop will double, south Asia & Latin America will remain constant & east Asia into relative decline. Developed world drop form 23% to 17% in terms of world pop. Falling Pop numbers: Western Europe…. EG Switzerland & Sweden will have zero growth rates by 2010, North Am. By 2030 & China by 2070. Problem: Shortage of skilled labour, science & technology graduates & shortage of taxes to sustain pensions & services.
Demographic Transition Model • Countries go through predictable changes as the country develops economically • 5 stages to pass through
The Population Cycle – Stages 1-5 • Stage 1: High birth rate, high death rate. Low population growth due to famine, disease, and natural disasters. Underdeveloped region – dependent on agriculture. E.g. Somalia (Europe 1700) • Stage 2: The economy improves. Money is spent on healthcare and clean water. Birth rate stays high, death rate drops a dramtically. Population increases. E.g Nigeria and Bangladesh (Europe 1800’s) • Stage 3: Social and economic development continues. People start having less children as most children survive to adulthood, lower infant mortality. Population increase slows but continuous increasing e.g. China, Mexico (Europe early 20thC)
Stage 4: Low birth rate and death rate. Small population growth.The country is now wealthy. Women have an improved standing in society. Family planning is widespread. E.g. Ireland, Thailand • Stage 5: The death rate is higher than the birth rate. People have very few children. The population starts to decline. Population in decline Germany and Italy • Ireland expected to reach this stage in 20yrs
Factors Affecting Population Change • The Status of Women • When women are educated and involved in careers outside the home they have less children. • This greatly reduces the population growth of a country.
3 ChildrenFamilies After 3 generations there are 27 children being born. 2 ChildrenFamilies After 3 generations there are only 8 children being born.
Dependency ratio • This is the ratio between the non-working population ( children under 15 and elderly dependents over 65) and the workers ( the economically active adults 15 and 65). • To get the dependency ratio for a country we add the number under 15 and the number over 65, divide this into the 15 to 65 age and multiply by 100. Ireland 2002. Under 15 = 827,428 Over 65 = 436,001 Between 15 and 65 = 2,653,774 DR for Ireland 2002 = 0.48 ie 48 dependents per 100 workers or 1 per 2.1 workers.
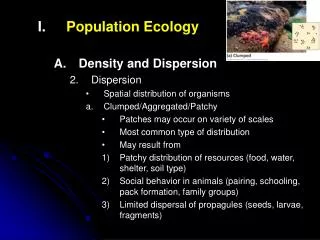
Population pyramid • Three types progressive, stationary, regressive
Population pyramid • Progressive: wide base narrow top (stage 1-3) • Stationary: square shape (stage 4) • Regressive: wide top narrow base (stage 5)
Population pyramid Carefully study the population pyramids of Kenya and India. For both countries • Calculate the total percentage (male & female) aged between 0 and 14 years • Calculate the total percentage ( m & f) aged 65+. • From your calculations state which country has (a) the highest percentage of children; (b) the highest percentage of old people. • From your study of the population cycle, explain the reasons for the %s in 3a and 3b. • Which of these countries could best afford free (a) primary education; (b) secondary education and (c) third level. Explain each of your answers. • Which pyramid shape indicates (a) an industrially emergent country; (b) a newly industrialized country? Explain.
Case study: China The one child policy • 1949-1976: population grew by several hundred million • Average fertility: 6 children per mother • Pursued vigorously in urban areas: one child allowed • Rural areas second allowed if first is a girl • Fines and penalties apply to those who don’t comply
China problems associated to the one child policy Gender bias • Resulted in imbalance in the sexes of babies • Ratio of 106.7boys: 100 girls cenus fig. believed to be as high as 117:100 • Need for agricultural labour • Pride in sons (tradition) some families consider it a dishonour not to have a male heir
China problems associated to the one child policy Female abortion • Some couples have ultrasounds to identify the sex of the baby (rural areas in the 2nd child) • Led to widespread abortion of female foetus • 1995 law passed banning abortion based on gender, reported that despite this female abortion and infanticide continue • 95.7% of foetus aborted are female
China problems associated to the one child policy Non registered births • Birth of females are sometimes not registered leading to females living in illegal limbo • 90% children in orphanages are abandoned girls
Results of one child policy • Transition from high birth rate to low birth rate • Moved from stage 2 to stage 4 • Population still growing due to vast amount of young married couples (9million + annually)
Case study: Ireland Changes in density and distribution • Pre famine(1845-1848)agricultural rural economy(pop. 8million +)(113km sq) • Post famine: emigration and death reduced pop. • Early 20th century move of people eastwards urban areas (GDR) • Today 66% of Irish live in urban areas
Case study: Ireland Population density and distribution • Lowest in west, midlands & Islands • Some fertile lands have low density also as settlement retricted • Highest density in coastal lowlands and river valleys e.g Blackwater • Well drained, fertile land and sea ports at river mouths
Change over time: • Post famine emigration continued, • Reached there lowest levels in 1960 (2.6 million) (39km sq) • Economic growth and in migration in 1960’s • Lemass Era (economic policies), MNC, jobs, inwards migration, EEC 1973
First pop growth in 120 yrs between 1971 and 1981 • 1980’s Recession & Emigration, 200,000 people emigrated during 80’s • 1990’s Celtic Tiger, inward migration, urbanisation due to concentration of jobs in these areas
66% of population today urbanised • Largest increase in East • Dublin, Louth Kildare, Wicklow up by 40% • Recession again in recent times so emigration returned • Despite this pop expected to reach 5m by 2015
Case study: Ireland Changes in population structure • Population aging (greying)rapidly • Present: over 65s =11% of population • Under 15’s down 10% since 70’s • 2020= 14% of population over 65 • 2050= 29% of population over 65 • Birth rate halved since 1980’s at 4 • Economically active group (15-64yrs) up from 58% to 68% in 45yrs