Download
1 / 20
210 likes | 653 Vues
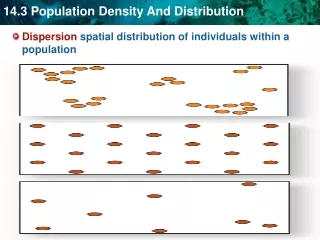
Population Ecology Density and Dispersion Dispersion Spatial distribution of organisms Clumped/Aggregated/Patchy Patches may occur on variety of scales Most common type of distribution May result from Patchy distribution of resources (food, water, shelter, soil type)

E N D
Population Ecology • Density and Dispersion • Dispersion • Spatial distribution of organisms • Clumped/Aggregated/Patchy • Patches may occur on variety of scales • Most common type of distribution • May result from • Patchy distribution of resources (food, water, shelter, soil type) • Social behavior in animals (pairing, schooling, pack formation, family groups) • Limited dispersal of propagules (seeds, larvae, fragments)
Population Ecology • Density and Dispersion • Dispersion • Uniform • Individuals evenly spaced • May result from • Territoriality (seabird nests, wolf territories) • Competition (plants with allelopathic defenses) • Random • No distinct distribution pattern • Relatively rare (environment usually imposes pattern on distribution) • May change over time • Ex: Trees may be patchy when young and become more uniform as they grow larger
Population Ecology • Demography • Study of vital statistics that affect populations • Changes in population size caused by four processes • Natality (birth rate) • Mortality (death rate) • Immigration rate • Emigration rate
Population Ecology • Demography • Patterns can be studied with life table • Used to track cohorts
Population Ecology • Demography • Data in life table may be easier to visualize graphically – survivorship curve
Population Ecology • Life History • Includes strategic tradeoffs among traits • Age at first reproduction (age at maturity) • Frequency of reproduction • Number of offspring per reproductive event • Parental care • Semelparity – “Big Bang” Reproduction • Ex: Salmon, Agave (century plant) • Favored in unpredictable environments with high offspring mortality • Iteroparity – Repeated Reproduction • Ex: Humans, most mammals • Favored in predictable environments with intense competition for resources • How does parental care affect parent survival?
European kestrel Fig. 53.13 3-4 5-6 7-8
Population Ecology • Population Dynamics • In a closed system (no I or E), change in population caused only by birth & death ΔN/Δt = B - D • N – Population size • t - Time • B – Birth rate • D – Death rate
Population Ecology • Population Dynamics • b – Per capita birth rate • m – Per capita death rate • B = bN • D = mN • r = b - m • r = Per capita growth rate ΔN/Δt = bN - mN = rN dN/dt = rN • r > 0 population growing • r < 0 population shrinking • r = 0 ZPG
Population Ecology • Population Dynamics • Exponential population growth • Under ideal conditions, r is as high as possible for a species • rmax – Intrinsic rate of increase • Inversely related to generation time dN/dt = rmaxN
Kruger National Park, South Africa Fig. 53.8
Population Ecology • Population Dynamics • Logistic population growth • Exponential growth not sustainable indefinitely in the real world • Assumes/Requires unlimited resources • Increasing population density limits ability of individuals to acquire resources • Density affects/limits population growth rate • Given environment only can support limited number of individuals • Carrying capacity (K) dN/dt = rmaxN (K-N)/K