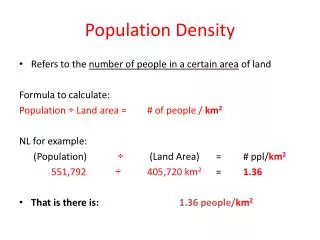
Population Density
Population Density. Exploring the relationship between population and land area. Population in 2005. The population of the world by the end of 2005 will be approximately 6,464,750,000 people. The population density of the world in 2005 is 48 people per square kilometer. Population in 2050.

Population Density
E N D
Presentation Transcript
Population Density Exploring the relationship between population and land area
Population in 2005 • The population of the world by the end of 2005 will be approximately 6,464,750,000 people. • The population density of the world in 2005 is 48 people per square kilometer.
Population in 2050 • How old will you be in 2050? • Do you think you will havechildren of your own in 2050? • The projected population of the world in 2050 is 9,075,903,000. • The projected population density is 67 people per square kilometer.
Population in Theory • If each of these boxes represent 1 square kilometer and each black dot represents a person, this is what the world’s population density would look like in 2005 and 2050. 2005 2050
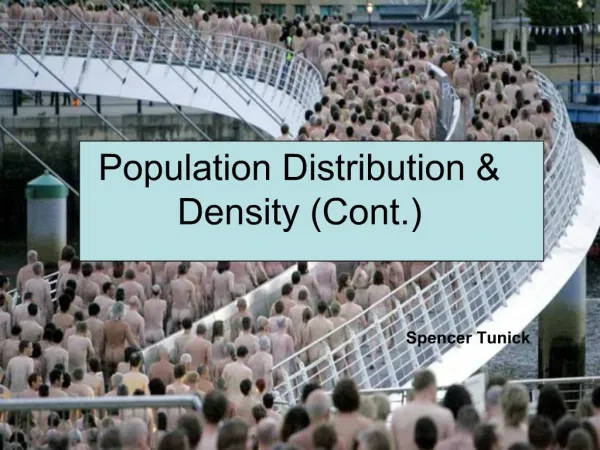
Population in Reality • In reality, the population density much more dense in some places than others. Urban areas are more dense than rural areas, and some countries are more dense than others. 2005 2050
Purpose • This exercise helps students compare the relative population density of different countries and examine its effects.
The World • The total population of the world is: • Approximately 6,326,005,560 people • The total land area of the world is: • Approximately 510,072,000 sq km
World Population • The three most populous countries are: • China - 1,273,111,290 people • India - 1,029,991,145 people • United States - 278,058,881 people • Their land areas are: • China - 9,326,410 sq km • India – 2,973,190 sq km • United States - 9,158,960 sq km
Let’s Round the Numbers • Take these numbers and round them to the nearest hundred million. China - 1,273,111,290 ≈ 1,300,000,000 Hundred million place ≈ 1,000,000,000 India - 1,029,991,145 Hundred million place ≈ 300,000,000 • United States - 278,058,881 Hundred million place
More Rounding! • Then round these numbers to the nearest million. China - 9,326,410 sq km ≈ 9,000,000 sq km Millions place • India – 2,973,190 sq km ≈ 3,000,000 sq km Millions place • United States - 9,158,960 sq km ≈ 9,000,000 sq km Millions place
Land Resources in China and the U.S. • Take your rounded numbers for the areas of China and the United States and find the ratio of land area between China and the United States. • Do the figures you calculated seem to match the relative sizes of the countries on the two maps?
Population in China and the U.S. • What is the ratio of people in China to people in the United States?
Population in China and the U.S. • Take the candies and separate them into groups representing the ratio of people in China and the U.S. • It is easy to do this by taking the ratio and count that number for each pile until they are all gone. • For example: If the ratio was 2:1, you would put 2 in the first pile and then 1 in the second pile over and over until they are all gone.
How many people per candy? • Now count the number of candies that you have in the China pile. How many people are represented by each candy? • Example if you have 50 candies in the China pile and there are 1,300,000,000 people in China then: 2 6 ,000,000 50 1,300,000,000 -10 300 This means with 50 candies each candy represents 26,000,000 people. -300 0 • Now you can do the same with the United States numbers!
Putting It All Together • Now take the candies that are for China and put them inside the lines on your map. • Then take the United States candies and put them inside the lines of your United States map.
Discussion • Which country has more space per person? • How do you think this would change a person’s experience living in that country? • Look at a population map of China and the United States. Is the population spread out evenly? Why or why not?