Population Pyramids and Population Density Maps
Population Pyramids and Population Density Maps. Population. Two useful ways that geographers can graphically display population information include: Population Maps to depict population density Population Pyramids to depict population distribution. Population Density….

Population Pyramids and Population Density Maps
E N D
Presentation Transcript
Population • Two useful ways that geographers can graphically display population information include: • Population Maps to depict population density • Population Pyramids to depict population distribution
Population Density… • …is a measure of how many people live in a certain unit area • Take the population of a region and divide it by its square area • Ex.: The population density of Texas is 79.6/mi² • On average, 79.6 people live in a square mile in Texas
One type of population map shows one dot for every certain number of people who live in a place:
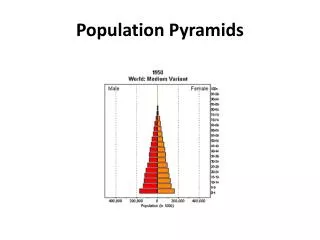
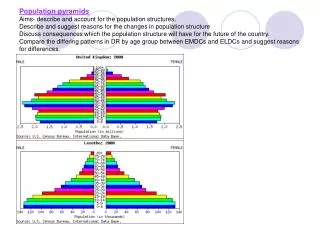
Population Pyramids • A population pyramid is a bar graph, usually in the shape of a pyramid, used to compare different age groups of men and women.
Population Pyramids • These graphs show how a population is distributed between age groups and sexes by percentages or numbers.
Lower age groups are at the bottom • Men are left of center • Women are right of center
In this pop. pyramid, the majority of the population is young, because there is a high birth rate and a high death rate
India, year 2000: large young population, high birth rate, high death rate
India, year 2025: death rate decreases, the younger population grows older
India, year 2050: the population has bulged in the 25-39 age groups
The Aging of Japan Low Death Rate and Dropping Birth Rate
Triangle • Developing • Rapid Growth
Box • Developed • Slow Growth
Modified box, glass or cup • Higly Developed • Negative Growth
Population Growth Theories Malthusian Theory • In 1798 Thomas Malthus published his theory • The population will continue to grow until it surpasses the food supply • People will starve reducing the population back to a sustainable level
Neo-Malthusian Theory • The population is growing faster than Malthusian anticipated • Beyond the capacity of food and: • Clean air • Living space • Fuel
Evidence: Starvation in Africa Loss of farmland in China, South America, and Africa Natural disasters worldwide According to these theories, a catastrophe is imminent to reset the population • World population since 500 A.D.
What do you think is going on in each U.S. city? Write down your guesses in your important books.