POPULATION PYRAMIDS
POPULATION PYRAMIDS. Objectives. WHAT is a population pyramid? HOW to read a population pyramid? Recognize SHAPES of population pyramids. IMPORTANCE of population pyramids. What is a population pyramid?.


POPULATION PYRAMIDS
E N D
Presentation Transcript
Objectives • WHAT is a population pyramid? • HOW to read a population pyramid? • Recognize SHAPESof population pyramids. • IMPORTANCE of population pyramids.
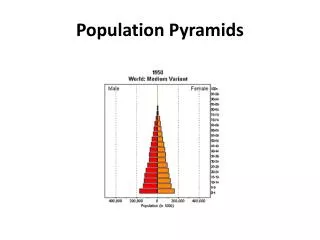
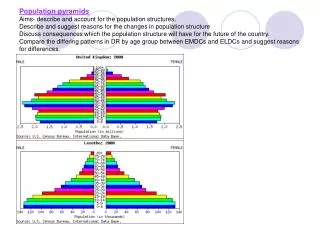
What is a population pyramid? • It is a diagram that gives information about the proportion of males and females in each age group. • Also shows: - proportion of young people (0 -14 ) - proportion of working people (15 – 59) - proportion of elderly people (60+)
What is a population pyramid? Vertical Axis - Age Groups Elderly dependents Working population Young dependents Horizontal Axis – Percentage / number
How to read a population pyramid? • Read the title e.g. country or city or racial group • Comment on general shape of the pyramid • Note the proportion of people in various age groups • Note the sex ratio • Interpret the data
Types of Population Pyramid 1. Triangular-shaped 2. Beehive-shaped Pyramid 3. Rectangular-shaped Pyramid Shape of pyramids is controlled by • births, • deaths, & • migrations.
Broad-based Pyramid Title: India, 2000 Shape: Broad Base - high birth rates Narrow Top - small elderly pop - high death rate Proportion: - Large proportion of young - high young dependency ratio Sex Ratio: Balance pyramid - Balance sex ratio
Indonesia 2000 Malaysia 2000
Beehive-shaped Pyramid Title: Singapore, 2000 Shape: Rocket-shaped / Narrow Base – Low Birth Rates, Slow pop growth Proportion: Large proportion of working population, 15-59 yr old - large group of economically active pop Sex Ratio: Balanced pyramid
Hong Kong 2000 Taiwan 2000
Rectangular Pyramid Title: Netherlands, 2000 Shape: Rectangular-shaped - Zero Pop Growth Narrow Base - Low Birth Rates - Life-expectancy is high e.g. 80+ - Low death rates Proportion: Bars of equal length - Balance Proportion Sex Ratio: Balance pyramid - Balance Sex Ratio
UK 2000 Netherlands 2000
Each pyramid tells a story about the past, present & futureof a country & its people.
Importance of Population Pyramids • Policy Planning ~ future housing estates ~ future schools ~ future jobs • Comparison with other countries ~ developed (US) vs developing (India)
Your turn… • Look at the shape • Find the trend • Remember your basic shapes
United States, 2000 More boys in younger age groups than girls Reversal of ratio in upper age groups Shifts around age 35 Slow growth
China, 2000 Efforts to reduce the birth rate have contributed to a prominent male majority. Since the early 1980s, parents try to have a male child if they are only having one child Boys culturally seen as more beneficial than a female Imbalance Could lead to instabilities
Mexico, 2000 Pyramid shape Rapid growth
Iceland, 2000 Generally straight except for older age groups Stable population
Japan, 2000 Top-heavy shape Shrinking population
Germany, 2010 Negative growth
Sweden, 2010 Somewhat stable; could be beginning a pattern of negative growth
Kenya, 2010 Looks like slow growth Dying younger The situation in Kenya: young adults with AIDS are dying leaving a very young population in its place
Brazil, 2010 Looks like the pattern of rapid growth was interrupted by something Growth rate is again rising
Russia, 2010 Very unbalanced at top between males and females. Transitioning between patterns of rapid growth; either slowing or beginning to grow again.
North Korea, 2010 Beginning period of negative growth Had previously experienced rapid growth Females outnumber men in older ages