Population Pyramids
Population Pyramids. How we observe and document population trends. Population Pyramids…. … are illustrations divided into [male] and [female] columns that show the distribution of ascending age groups in a selected population. Patterns of Population Pyramids. Rapid Growth Pyramids.


Population Pyramids
E N D
Presentation Transcript
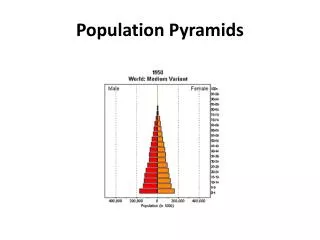
Population Pyramids How we observe and document population trends
Population Pyramids… … are illustrations divided into [male] and [female] columns that show the distribution of ascending age groups in a selected population
Rapid Growth Pyramids • Pyramids that are shaped like an inverted V can be explained by many different factors, including: • Poverty • A Lack of Birth Control • A 3rd World Economy • A Lack of Healthcare • Low Standards of Living • Low Cost of Living
Slow Growth Pyramids • Pyramids that are shaped like a beehive can also be explained by many different factors, including: • Relative Wealth • Birth Control & Education • A 1st World Economy • Some/Good Healthcare • Good Living Conditions • Moderate Living Costs
Negative Growth Pyramids • Pyramids that are taper towards the bottom can be attributed to many different factors, including: • Abundant Wealth • Extensive Birth Control & Education • A 1st World Economy • Extensive Healthcare • Excellent Living Conditions • Expensive Cost of Living
Creating a Population Pyramid Take your Age-Sex Data Table and observe the population of Country A: 6,420,792 Now look at the number of Males from the age of 0-4: 479,894 479,894 / 6,420,792 = .0747, or 7.5% You multiply the product by 100 to achieve a percentage, then round up to the nearest half. Now take your Age-Sex Graphand draw a vertical line between 7 and 8 (7.5%) in the bottom left bracket (Males 0-4). Color the area from this line to the centerline blue to represent the percentage of the population which are males from the ages of 0 to 4. When you duplicate this process for the other side, use a pink or red color to represent females from the ages of 0 to 4. Continue repeating steps 1 through 5 all the way to the 100+ bracket using the data from your Age-Sex Data Table.