Population Pyramids
Population Pyramids. Global Geography 12. Population Pyramids. A graph that shows the age-sex composition of a population. Cohorts.


Population Pyramids
E N D
Presentation Transcript
Population Pyramids Global Geography 12
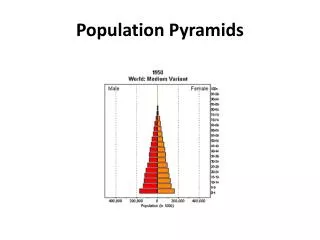
Population Pyramids • A graph that shows the age-sex composition of a population.
Cohorts A specific portion of the population that is combined together in an age group for the purposes of simplifying a population pyramid. Five-year cohorts are commonly used in population pyramids.
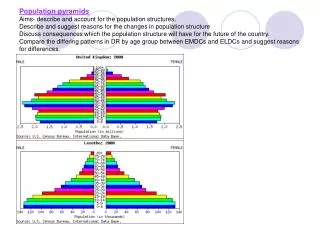
2 Types of Population Pyramids 1) expansive: An age-sex structure with a wide base and narrower top. This indicates a high birth rate and an expanding population. 2) stationary: An age-sex structure that indicates no or very little population growth. The pyramid is characterized by relatively straight sides.
Dependency Ratio • The ratio between the number of dependants (anyone above or below the working age) and the number of people in the potential labour force. This ratio gives an indication of the level of economic development in the country as the higher the percentage of people of working age a country has the better off economically they should be. • young dependants (YD): Anyone younger than 15 • old dependants (OD): Anyone 65 and older • Dependency ratio = YD (%) + OD (%) x 100 People of working age (%)
Demographic Transition • A multi-staged model showing changes in population as a result of a country’s economic development. The model is based on the changing population of Western Europe during industrialization.
4 Stages of the Demographic Transition Model 1) Primitive: High birth & death rates, moderately high population growth, primitive health and medical conditions, low life expectancy rate, very poor standard of living, least developed countries (LLDCs). 2) Early Expanding: High birth rate, death rate drops dramatically, improved medical conditions, largely agricultural and rural population, large families, explosive population growth, less developed countries (LDCs).
4 Stages of the Demographic Transition Model (continued) 3) Late Expanding: Birth rate drops in response to high growth of stage 2, death rate continues to drop slowly, improved standard of living & change in societal values, birth control improved, women join the labour force, more urban nation (less rural), more manufacturing & industry, smaller families, total population growth is moderate and lowering. 4) Zero Growth: Low birth & death rates, good medical & health conditions, long life expectancy, high standard of living, little population growth occurs-approaching zero population growth rate/ negative population growth, more developed countries (MDCs).
Canada’s Dependency Ratio in 2006 • Young dependants =young males (2.7% + 2.9% + 3.4%) + young females (2.6% + 2.8% + 3.2%)= 17.6% • Old dependants =old males (1.9% + 1.6% + 1.2% + 0.8% + 0.5%) + old females (2% + 1.8% +1.6% + 1.3% + 1.1%)= 13.8% • People of working age =100% - (17.6% + 13.8%)= 68.6% • Dependency ratio = YD (%) + OD (%) x 100 People of working age (%) • Canada’s Dependency Ratio for 2006 = ( (17.6% + 13.8%)/ 68.6% ) x 100 = 45.8 per 100 workers
Canada is in Stage 4 of the Demographic Transition Model Because: Low birth & death rates Good medical & health conditions Long life expectancy High standard of living Little / negative population growth occurs More developed country (MDC).
Animated Canadian Population Pyramids http://www12.statcan.ca/census-recensement/2006/as-sa/97-551/tables-tableaux-notes-eng.cfm#animations
Population Pyramids of the World http://populationpyramid.net/
Review • Population Pyramids • 2 Types: Expansive & Stationary • Dependency Ratio • Demographic Transition Model • 4 (or 5) Stages of the Demographic Transition Model