Population Pyramids: Understanding Population Composition and Predictions
Population pyramids are diagrammatic representations of age and sex distribution in a population. They help analyze birth and death rates, fertility rates, life expectancy, and gender differences. By studying population pyramid shapes, you can predict future growth trends. Different shapes like unstable, expanding, stable, stationary, or declining indicate distinct population characteristics. This tool is crucial for understanding a country's status and making informed predictions about its future demographic changes.


Population Pyramids: Understanding Population Composition and Predictions
E N D
Presentation Transcript
Population Pyramids A Scafolded Analysis
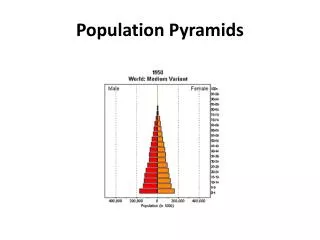
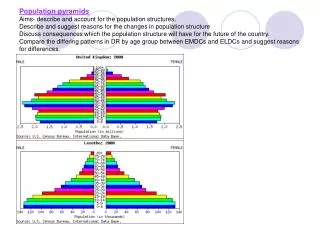
What is a population pyramid? • A diagrammatic representation of the age and sex composition of a population. • Allows you to analyze trends in birth & death rates, fertility rates, infant mortality rates, life expectancy as well as in similarities and differences in gender. • Helps to make predictions about future growth or decline. • Can give insight to the status of a particular country (core, periphery, semi-periphery).
Is really two bar graphs, one male and one female, back to back.
Analyzing population pyramids • Using the shape of the population pyramid, you can make predictions about a country’s future growth There are five general shapes to look for: • Unstable • Expanding • Stable • Stationary • Declining
Unstable Population Concave Pattern Characteristics 1) High birth & High Death rates 2) Low life expectancy 3) Brings a countries social, economic and political system into question (lack of contraceptives, lack of medical treatment, disease, war, famine, lack of opportunity) 4) Rural society with a large emphasis on agriculture
Expanding Population • Characteristics • High birth rates with a decreasing death rates • life expectancy starting to improve • 3) Features suggest that there are improvements in the medical system (medication, treating disease, technology, nutrition improving, Quality of life improving) • 4) This is the stage where a country’s population begins to increase rapidly (high BR, lowering DR) • 5) There are lots of young people and the elderly population is increasing, but slowly.
Stable Population Crown or wall feature 1) Slow growth (Birth Rate is still greater than Death Rate ) 2) Birth Rate is declining rapidly & Death Rate continues to decline eventually levelling out (people are beginning to live longer) 3) High life expectancy 4) This suggests a good medical system and availability of contraceptives and medical treatment. There is also significant increases in incomes and standard of living. There is a transition away from having many children for reasons such as cost and opportunities for women.
Stationary / No Growth Population This pyramid is tapering but it is not a complete inverted triangle. 1) All age groups have similar population sizes 2) Birth Rate & Death Rates are low 3) There is high Life Expectancy 4) There are less and less babies being born 5) Essentially little to no growth (Birth rate = death rate) 6) This graph suggested that the country has a high standard of living, lots of job opportunities (male and female), cost of living is expensive, good medical system, immigration and family planning incentives is a tool that is used to help address the slow growth
Declining Population 1) Some predict that Germany and Italy are entering this stage. This pyramid also represents a prediction of future trends 2) Low birth & death rate 3) High Life Expectancy 4) The death rate is higher than the birth rate 5) Some suggest that without drastic measures to population policies that this process is almost irreversible. 6) These countries are core countries that enjoy the advancements and quality of life of modern day society.
Canada’s Population Pyramid *What can we decipher about Canada’s population from this pyramid? Which of the five classifications might we give to Canada? How did our population pyramid reach this shape? Germany
Analyzing Pyramids Afghanistan 2009 • classification? • death rate? • birth rate? • life expectancy? • predicted growth? • periphery, semi-periphery or core?
Analyzing Pyramids • classification? • birth rate? • death rate? • life expectancy? • infant mortality? • predicted growth? • periphery, semi-periphery or core?
Analyzing Pyramids Brazil 2009 • classification? • birth rate? • death rate? • life expectancy? • infant mortality? • predicted growth? • periphery, semi-periphery or core?