Population Pyramids
This overview explores population pyramids, dependency ratios, and gender ratios, highlighting their significance in demographic studies. The dependency ratio compares the number of dependents (ages 0-15 and 65+) to the working-age population (ages 16-64). We analyze how different countries progress through stages of demographic transition, impacted by factors like birth rates, longevity, and immigration. Notably, trends in nations like the United States and China illustrate varying population structures and potential demographic challenges ahead.

Population Pyramids
E N D
Presentation Transcript
Dependency Ratio • The number of people who are too young or too old to work, compared to the number of people in their productive years
Dependency Ratio • 0-15 = Dependents • 16-64 = Workers • 65+ = Dependents • DR = Number of Dependents (0-15 and 65+) Number of Working-age (16-64) X 100
Population under the age of 15 - usually shown as a percentage of the total population of a country - dependency age is 0-15
Gender Ratio • Gender (Sex) Ratio: number of males per hundred females • In general more males are born than females • Males have higher death rates • Examples: Europe and North America = 95:100 Rest of World = 102:100
GenderRatio – Developing Countries • Have large % of young people –where males generally outnumber females • Lower % of older people – where females are typically more numerous • High immigration = more males
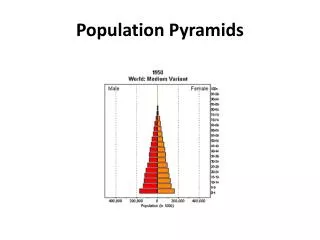
Population Pyramids • A country’s stage in Demographic Transition gives it a distinctive population structure • Also called Age/Sex Pyramids
Population Pyramid • Population composition on graph: • Males = left side of the vertical axis • Females = right side of the vertical axis • Age = order sequentially with youngest at the bottom and oldest at the top (usually by five-year cohorts)
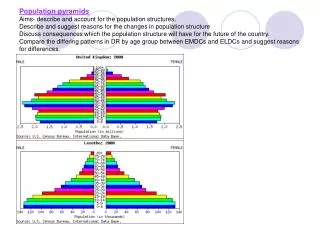
Rapid Growth • A country in stage 2 of the Demographic Transition Model • Large number of young people and a smaller older population
Slow Growth • A country in stage 4 of the Demographic Transition Model • Large number of “older people” • Smaller % of young people
No Growth • End of stage 4 • Large number of “older people” • Very small % of young people
Population Pyramid Summary for United States: 1950, 2025, 2050 • Population Pyramid Summary for United States: 1950, 2025, 2050
Population Woes for East Asia • China (1/5th of the world’s population • One-child policy-implemented in 1979, prevented over 400 million births. Reduced TFR from 5.3 to 1.5 • Fall in fertility rates due to improving economic and social factors in urban areas • Late-term abortions encouraged • Baby girls sold for average of $3,000/baby • Couples are fined $3,000 per additional child beyond one in urban areas WHAT WILL THEIR FUTURE PYRAMID RESEMBLE? • Japan • 1970s-BR 2.1/2010-BR 1.26 • Japanese are living longer • Highest proportion of elderly in the world • Currently 20% of population is over 65 • By 2040-40% will be over 65 WHAT WILL THEIR FUTURE PYRAMID RESEMBLE?