Download
1 / 12
120 likes | 406 Vues
Relationship Between Cholera and Ocean Net Heat Flux in the Bay of Bengal . By Erin James Department of Geography University of California, Santa Barbara. Introduction. Research questions Cholera — a brief history Remote sensing and cholera — prior research Study area Data Methodology

E N D
Relationship Between Cholera and Ocean Net Heat Flux in the Bay of Bengal By Erin James Department of Geography University of California, Santa Barbara
Introduction • Research questions • Cholera — a brief history • Remote sensing and cholera — prior research • Study area • Data • Methodology • Conclusion
Research Questions • Does climate change affect disease? • Can the environmental factors associated with disease be quantified from space? • What is the association between plankton blooms and cholera outbreaks? • Can we create an accurate model to predict when cholera outbreaks will occur?
Cholera — A Brief History • ~ 10 A.D. — Historical records in Greek and Sanskrit describe cholera-like disease • 1563 — First epidemic of cholera described by Garcia del Huerto in India • 1817 — First recorded pandemic. Lasted six years; related to wars occurring at the time • 1829-1851 — Second pandemic spread from Russia to Americas. Hit New York in 1832 and London, near the home of Dr. John Snow in summer of 1849
Broad Street Pump — 1854 • Source:Map 1. Published by C.F. Cheffins, Lith, Southhampton Buildings, London, England, 1854in Snow, John. On the Mode of Communication of Cholera, 2nd Ed, John Churchill, New Burlington Street, London, England, 1855. www. ph.ucla.edu/epi/snow.html
Cholera and the Sea • John Snow first discovered cholera’s mode of transmission — waterborne • 1883 — Robert Koch isolated cholera vibrio from patients; proved this was the agent of the disease • 1961-present day — Seventh pandemic. All of the pandemics followed coastlines of the world oceans • The association of Vibrio cholerae with zooplankton has proven to be a key factor in understanding cholera epidemics (Colwell, 1996; Huq et. al, 1996; Lobitz et al., 2000).
Copepods source: www.hsph.harvard.edu • Microscopic view of a female copepod with V. cholerae attached to her egg casing
Cholera and Remote Sensing • Several research groups have investigated cholera outbreaks indirectly by measuring phytoplankton blooms with satellite imagery • Sea surface temperature (SST), sea surface height (SSH), and El Niño have all been considered as factors affecting cholera (Lobitz et al, 2000; Pascual, 2000) • The Bay of Bengal is a useful research region: • Five major rivers in the Indian subcontinent flow into the Bay of Bengal. • Extensive data set of cholera incidence in Dhaka
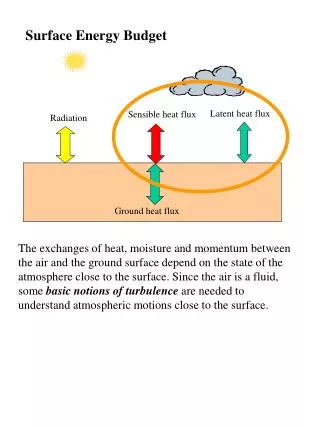
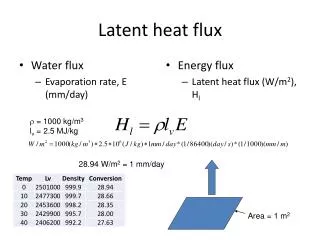
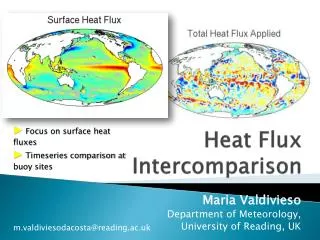
Data • SST vs. Net heat flux — UCSB’s Institute for Computational Earth Systems Science has been developing a method to better estimate surface heat fluxes. • International Center for Diarrheal Disease Research, Bangladesh, has monthly time series data for cholera cases.
Methodology • Create a model driven by satellite remote sensing that more accurately accounts for interannual frequency of cholera cases using seasonality and net heat flux as predictors. • Previous approaches: • Neural Net models • Transient coupling
Conclusion • Expect to create a more accurate fit between cholera incidence, ocean temperature and possibly ENSO • Data sets exist • Broad Implications: • Provide an early warning system for cholera outbreaks • Cholera is a disease that can be reduced via simple technologies and education


![Heat Flux [Wm -2 ]](https://cdn3.slideserve.com/5899967/heat-flux-wm-2-dt.jpg)