Download
1 / 29
290 likes | 407 Vues
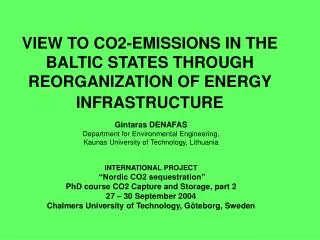
VIEW TO CO2-EMISSIONS IN THE BALTIC STATES THROUGH REORGANIZATION OF ENERGY INFRASTRUCTURE. Gintaras DENAFAS Department for Environmental Engineering, Kaunas University of Technology, Lithuania INTERNATIONAL PROJECT “Nordic CO2 sequestration” PhD course CO2 Capture and Storage, part 2

E N D
VIEW TO CO2-EMISSIONS IN THE BALTIC STATES THROUGH REORGANIZATION OF ENERGY INFRASTRUCTURE Gintaras DENAFAS Department for Environmental Engineering, Kaunas University of Technology, Lithuania INTERNATIONAL PROJECT “Nordic CO2 sequestration” PhD course CO2 Capture and Storage, part 2 27 – 30 September 2004 Chalmers University of Technology, Göteborg, Sweden
Gintaras Denafas “VIEW TO CO2-EMISSIONS IN THE BALTIC STATES THROUGH REORGANIZATION OF ENERGY INFRASTRUCTURE” The total installed capacity of the Baltic integrated power system is 11000 MW which includes different types of technologies: • the nuclear power plant in Ignalina (Lithuania); • hydro power plants; • condensing power plants; • combined heat-power (CHP) plants; • pumped storage power plant; • wind energy to be penetrating step-by-step as well. PhD course CO2 Capture and Storage, part 2 27 – 30 September 2004, Chalmers University
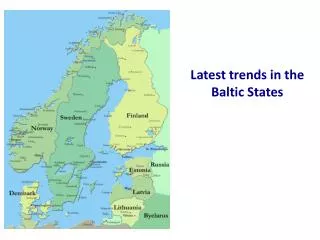
Gintaras Denafas “VIEW TO CO2-EMISSIONS IN THE BALTIC STATES THROUGH REORGANIZATION OF ENERGY INFRASTRUCTURE” • The largest part of this capacity - 55,5% - is installed in Lithuania followed by 24,5% in Estonia and 20% in Latvia. • Each of three Baltic states is characterised by different dominating types of power generating capacities. PhD course CO2 Capture and Storage, part 2 27 - 30 September 2004, Chalmers University
Gintaras Denafas “VIEW TO CO2-EMISSIONS IN THE BALTIC STATES THROUGH REORGANIZATION OF ENERGY INFRASTRUCTURE” • The next coming years may be characterised as to be crucial turning points for the re-organization of Baltic power structure. • It will continue the reconstruction of Estonian power sector, the reconstruction of two Latvian CHP plants is planned. • However the most important consequences will be brought by the closing the Lithuanian Ignalina nuclear power plant (INPP) and potential replacement of it by other power production alternatives. • Thus INPP is a key-element for the re-organization of power generation in the Baltic states. PhD course CO2 Capture and Storage, part 2 27 - 30 September 2004, Chalmers University
Gintaras Denafas “VIEW TO CO2-EMISSIONS IN THE BALTIC STATES THROUGH REORGANIZATION OF ENERGY INFRASTRUCTURE” • Ignalina Nuclear Power Plant is one of the largest in the world and two Russian atomic reactors RBMK-1500 (the thermal power output is 4800 MW, nominal electrical power capacity is 1500 MW) are functioning at present. • Lithuania have been obligated to close these reactors (Block 1 till 2005, Block 2 till 2010), whichever don’t correspond EU security norms; it was one from main preconditions for Lithuanian membership in EU. • But on the other INPP is the securest nuclear power on the world because a modern Swedish security system had been installed here. • Now INPP generated 80-85% of the total electricity in Lithuania, but for the three Baltic countries this part reach about 47%. PhD course CO2 Capture and Storage, part 2 27 - 30 September 2004, Chalmers University
Gintaras Denafas “VIEW TO CO2-EMISSIONS IN THE BALTIC STATES THROUGH REORGANIZATION OF ENERGY INFRASTRUCTURE” • Evidently, the future development of the whole Baltic energy sector is greatly influenced by the future of INPP or nuclear energy in general. There are two possible investigated scenarios: • scenario 1 - closure date of Block 1 is 2005, closure date of Block 2 is 2010 • scenario 2 - closure date of Block 1 is 2005, exploitation of Block 2 is extended at least until 2020. • There is a lot of official debate about the construction of a new modern nuclear reactor at Ignalina as well. PhD course CO2 Capture and Storage, part 2 27 - 30 September 2004, Chalmers University
Gintaras Denafas “VIEW TO CO2-EMISSIONS IN THE BALTIC STATES THROUGH REORGANIZATION OF ENERGY INFRASTRUCTURE” • However, the closing of INPP may have negative environmental as well as other consequences. • It is of great importance to evaluate the impact of Ignalina NPP closure on the possibilities of Lithuania and other Baltic states to comply with obligations under international conventions on climate protection and air pollution. • At present, Baltic States meet all requirements of international conventions on air pollution and their protocols were ratified in the last years. PhD course CO2 Capture and Storage, part 2 27 - 30 September 2004, Chalmers University
Figure 2Electricity generation in Lithuania, Latvia and Estonia according to Scenario 1
Figure 3 Electricity generation in Lithuania, Latvia and Estonia according to Scenario 2
Gintaras Denafas “VIEW TO CO2-EMISSIONS IN THE BALTIC STATES THROUGH REORGANIZATION OF ENERGY INFRASTRUCTURE” • The Baltic States have signed the UNFCCC in 1992 and ratified it in 1995. • The main obligation of Lithuania, Latvia and Estonia according to UNFCCC is to stabilize CO2 emissions, maintaining 1990 level of emissions in 2000. • Kyoto protocol was signed in 1997 imposing to reduce emissions of greenhouse gases by 8 below 1990 levels by the years 2008-2012. PhD course CO2 Capture and Storage, part 2 27 - 30 September 2004, Chalmers University
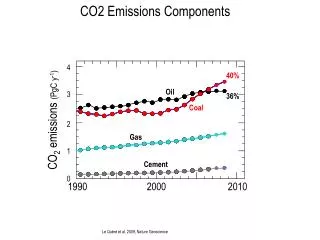
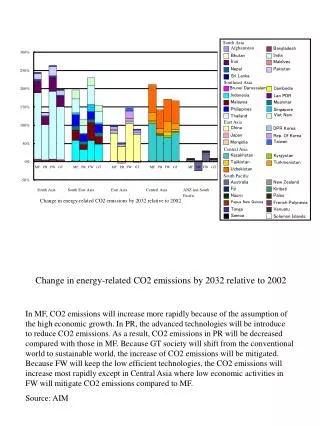
Gintaras Denafas “VIEW TO CO2-EMISSIONS IN THE BALTIC STATES THROUGH REORGANIZATION OF ENERGY INFRASTRUCTURE” • In the Baltic States the most significant source of greenhouse gases are heat and power production and transport. • Because of the development of industry during Soviet period, the pollution level at that time was high. • The value of CO2 emission in 1990 in Lithuania was 42 Mt. Compare with Latvia – total emission in 1990 was 23,5 Mt and Estonia – 36,2 Mt of CO2. PhD course CO2 Capture and Storage, part 2 27 - 30 September 2004, Chalmers University
Gintaras Denafas “VIEW TO CO2-EMISSIONS IN THE BALTIC STATES THROUGH REORGANIZATION OF ENERGY INFRASTRUCTURE” • Many mentioned thermal power plants and CHP are expected to use 40 heavy fuel oil and 60 natural gas; • Lithuanian PP - 40 orimulsion and 60% natural gas; • Mazeikiai CHP - 100 heavy fuel oil; • Estonian/Baltic PP - 100% oil shale. PhD course CO2 Capture and Storage, part 2 27 - 30 September 2004, Chalmers University
Gintaras Denafas “VIEW TO CO2-EMISSIONS IN THE BALTIC STATES THROUGH REORGANIZATION OF ENERGY INFRASTRUCTURE” CO2 formation (emission) factors, kg/GJ, for different fuel types PhD course CO2 Capture and Storage, part 2 27 - 30 September 2004, Chalmers University
Figure 4 CO2 formation forecast in Lithuanian, Latvian and Estonian power sector according to Scenario 1
Figure 5 CO2 formation forecast in Lithuanian, Latvian and Estonian power sector according to Scenario 2
Figure 6 The part of CO2 formation by power sector in the Baltic states in comparison with common 1990 level (Scenario 1)
Figure 7 The part of CO2 formation by power sector in the Baltic states in comparison with common 1990 level (Scenario 2)
Gintaras Denafas “VIEW TO CO2-EMISSIONS IN THE BALTIC STATES THROUGH REORGANIZATION OF ENERGY INFRASTRUCTURE” • Based on modelling results, Baltic CO2 emissions depend on the peculiarities of the power generating capacities in each of country; • Compare with 1990 level, this share in year 2010 varies (for the Scenario 1) from ~ 6% for Latvia to ~ 11% for Lithuania and ~ 25% for Estonia; for Scenario 2 these figures are lower. • These indicators characterise the significance of power production sector in relation to Kyoto protocol level and allows for evaluating the rest of total emissions, not to be exceeded by other sectors. • Importantly, the share of CO2 emissions formed by power generation in Latvia and Estonia will stay practically unchanged in the period 2011-2020, at the same time in Lithuania it will grow by up to ~ 23%. • It can be assumed with some probability that foreseen CO2 emissions values will not disturb Baltic states to agree with obligations of the Kyoto protocol, however for correct evaluation of this statement emissions forecasting for all other sectors has to be performed. PhD course CO2 Capture and Storage, part 2 27 - 30 September 2004, Chalmers University
Gintaras Denafas “VIEW TO CO2-EMISSIONS IN THE BALTIC STATES THROUGH REORGANIZATION OF ENERGY INFRASTRUCTURE” Conclusions • Model calculations point on the Ignalina nuclear power plant is one of the key-factors for reorganisation of power production system in the Baltic states’ region. • The impact of Ignalina NPP closure on the CO2 emissions’ development in the whole region context is identified. • According to two investigated energy sector development scenarios, Baltic CO2 emissions will increase. • CO2 formation due to power production according to Scenario 1 in the region of the Baltic states will change from 6900 kt/a in 2003 to 20400 kt/a in 2020, but according to Scenario 2, to 15200 kt/a in 2020. • I may be expected that this will not be an obstacle for Baltic States to comply with Kyoto protocol, therefore the implementation of CO2 sequestration methods should be applied only during emissions trade and corresponding feasibility study preparation or even creation of universal prognostic model are necessary. PhD course CO2 Capture and Storage, part 2 27 - 30 September 2004, Chalmers University