Download
1 / 44
440 likes | 530 Vues
CorridorOne is a collaborative project aiming to enhance distributed visualization techniques for ASCI applications. The team comprises experts from various institutions working towards advanced networking, collaboration technologies, and tool integration. Targets include climate modeling, combustion simulation, plasma science, and more.

E N D
Corridor One: An Integrated Distance Visualization Environment for SSI and ASCI ApplicationsStartup Thoughts and PlansRick StevensArgonne/Chicago Participants: Argonne, Berkeley, Illinois, Los Alamos, Princeton, Utah
CorridorOne: An Overview • The Team • Our Goals • Applications Targets • Visualization Technologies • Middleware Technology • Our Testbed • Campaigns • Timetable and First Year Milestones
The Team Rick Stevens Argonne National Lab stevens@mcs.anl.gov Maxine Brown University of Illinois maxine@uic.edu Tom DeFanti University of Illinois tom@uic.edu Adam Finkelstein Princeton University af@cs.princeton.edu Thomas Funkhouser Princeton University funk@cs.princeton.edu Chuck Hansen University of Utah hansen@cs.utah.edu Andy Johnson University of Illinois ajohnson@eecs.uic.edu Chris Johnson University of Utah crj@cs.utah.edu Jason Leigh University of Illinois spiff@evl.uic.edu Kai Li Princeton University li@cs.princeton.edu Dan Sandin University of Illinois dan@evl.eecs.uic.edu Jim Ahrens Los Alamos National Laboratory ahrens@acl.lanl.gov Deb Agarwal Lawrence Berkeley Laboratory daagarwal@lbl.gov Terrence Disz Argonne National Laboratory disz@mcs.anl.gov Ian Foster Argonne National Laboratory foster@mcs.anl.gov Nancy Johnston Lawrence Berkeley Laboratory nejohnston@lbl.gov Stephen Lau Lawrence Berkeley Laboratory slau@lbl.gov Bob Lucas Lawrence Berkeley Laboratory rflucas@lbl.gov Mike Papka Argonne National Laboratory papka@mcs.anl.gov John Reynders Los Alamos National Laboratory reynders@acl.lanl.gov Bill Tang Princeton Plasma Physics Lab tang@pppl.gov
Our Goals • Grid Middleware and Advanced Networking • Distributed Visualization and Data Manipulation Techniques • Distributed Collaboration and Display Technologies • Systems Architecture, Software Frameworks and Tool Integration • Application Liaison, Experimental Design and Evaluation
Distributed Data and Visualization Corridor Possible WAN Interconnection Points
Applications Targets • ASCI and SSI Applications Drivers • Climate Modeling (LANL) • Combustion Simulation (LBNL and ANL) • Plasma Science (Princeton) • Neutron Transport Code ( LANL) • Center for Astrophysical Flashes (ANL) • Center for Accidental Fires and Explosions (Utah ) • Accelerator Modeling (LANL)
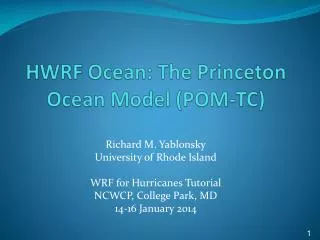
POP Ocean model 3000 x 4000 x 100 cells per timestep, 1000’s of timesteps Climate Modeling: Massive data sizes and time series
Combustion Modeling: Adaptive Mesh Refinement • Data is irregular, not given on a simple lattice • Data is inherently hierarchical
PROBLEM DESCRIPTION: Particle-in-cell Simulation of Plasma Turbulence PPPL • Key issue for Fusion is confinementofhigh temperature plasmas by magnetic fields in 3D geometry (e.g, donut-shaped torus) • Pressure gradients drives instabilities producing loss of confinement due to turbulent transport • Plasma turbulence is nonlinear, chaotic, 5-D problem • Particle-in-cell simulation distribution function solved by characteristic method perturbed field solved by Poisson equation
GYROKINETIC TURBULENCE SIMULATIONS ON NEW MPP’S Science 281, 1835 (1998) Without Flow With Flow With Turbulence reduction via sheared plasma flow, compared to case with flow suppressed. Results obtained using full MPP capabilities of CRAY T3E Supercomputer at NERSC ow Flow
MC++ : Monte Carlo Neutronics • Neutronics simulation of multi-material shell • Runs all ASCI platforms • Arbitrary number of particles
What Is The FLASH Problem? • To simulate matter accumulation on the surface of compact stars, nuclear ignition of the accumulated (and possibly stellar) material, and the subsequent evolution of the star’s interior, surface, and exterior • X-ray bursts (on neutron star surfaces) • Novae (on white dwarf surfaces) • Type Ia supernovae (in white dwarf interiors)
Paramesh Data Structures • Iris Explorer • Isosurfaces • Volume Visualization • Animations 100’s timesteps • Resolution moving to Billion zone computations
Uintah Simulation Runs Hypotheses Assumptions Configuration Parameters Fire Spread Container Dynamics HE Materials Interpretations Visualizations Datasets Software Versions Computing Resources Insight
Distributed/Parallel Uintah PSE Main Uintah PSE window on local machine Computed on remote resources Viewed locally
Accelerator model 300 million to 2 billion particles per timestep, 1000’s of timesteps Phase space Electromagnetic fields Accelerator Simulations
Distributed Visualization Technologies • Remote and Distributed Rendering • Protocols for Remote Visualization • Progressing Refinement • Deep Images and Image Based Rendering • Compression for Visualization Streams • Remote Immersive Visualization • Data Organization for Fast Remote Navigation • High-end Collaborative Visualization Environments • Collaborative Dataset Exploration and Analysis • User Interfaces and Computational Steering • Distributed Network Attached Framebuffers • Integration with Existing Tools
CorridorOne • Data Servers • Analysis and Manipulation Engines • Visualization Backend Servers • Visualization Clients • Display Device Interfaces • Advanced Networking Services
Distributed Scientific Visualization Passing data via messaging Serialization of vtk data structures, use C++ streams structured points, grids, unstructured grids, graphics Passing control via messaging Update protocol Protocols for Remote and Distributed Visualization Model Based Remote Graphics Database retrieval Geometry processing Rasterization Display 3-D primitives 2-D primitives High-level primitives Pixels
Example - Parallel Isosurface and Serial Rendering on a Linux Cluster
Progressive Refinement and Multi-resolution Techniques: Example Application • Particle Accelerator Density Fields • wavelet-based representation of structured grids • isosurface visualization with vtk
Multiresolution Display Development • Match display to human visual system most cones in 5 foveal spot • Optimal use of rendering power resolution where you need it • Match display to data resolution resolution where the data is High Resolution Inset Image Background Image
Remote Volume Rendering • “True” 3D presentation of 3D data • Blending of user-defined color and opacity • Reveals subtle details/structure in data that could be lost in isosurface rendering
Remote Visualization Using Image-Based Rendering Front View Side View
ActiveMural, Giant Display Wall • Argonne, Princeton UIUC Collaboration • 8’ x 16’ display wall • Jenmar Visual Systems BlackScreen™ technology, > 10000 lumens • 8 LCD 15 DLP 24 DLP • 8-20 MegaPixels
Network Attached — Virtual Frame Buffer VFB Net Command Interface VBF front-end server Serial semantics local framebuffer interface - output partitioning - blending - serial parallel - flexible transport - shadow buffer 3796p x 1436p (4x2) 5644p x 2772p (6x4) X-Windows ? OpenGL ? ggi ? Message passing, SM or DSM ... VFB back-end Servers (mapped one-one on graphics output) Accelerator Accelerator Accelerator Accelerator RAMDAC RAMDAC RAMDAC RAMDAC Projector Projector Projector Projector
The MicroMural Portable Tiled Display for High Resolution Vis and Access Grid
Access Grid Nodes Presenter mic Presenter mic Presenter camera Presenter camera Ambient mic (tabletop) Audience camera Ambient mic (tabletop) Audience camera • Access Grid Nodes Under Development • Library, Workshop • ActiveMural Room • Office • Auditorium
Components of an AG Node RGB Video Digital Video Display Computer Network Shared App, Control NTSC Video Video Capture Computer Digital Video Analog Audio Digital Audio Audio Capture Computer Mixer Control Computer RS232 Serial Echo Canceller
Collaborative Dataset Exploration and AnalysisCollaboration & Network Aware Visualization Tools • TIDE being built in collaboration with NCDM as a framework for navigating and viewing data-sets in Tele-Immersion. • Low-Res navigation • High-Res visualization • Set viewpoints then raytrace • Integrate annotation tools & multiperspective techniques. • Support VTK and make it collaborative. • Interface with other commonly used ASCI/SSI visualization tools such as HDF5. TIDE showing Compression of a Lattice (ASCI data)
Collaborative Dataset Exploration and AnalysisAnnotation and Recording • How do you record discoveries in tele-immersion? • V-Mail & Virtual Post-It notes attach to spaces, objects, or states. • Recording states and checkpoints. • Useful for documenting spatially located features. • Useful for asynchronous collaboration. • Querying in VR. • People tend to treat recordings as if they were still there. Viewing V-Mail in Tele-Immersion
Collaborative Dataset Exploration and Analysis Collaboration techniques & technology for navigating massive data-sets • Explore human factors to motivate the design of collaborative tools. • Take advantage of having more than 1 expert to help with interpretation and/or manipulation.Provide Multiple CooperativeRepresentations. • e.g. Engineer and artist. • e.g. Partition multi-dimensions across viewers. • e.g. People with different security clearances. • CAVE6D implementation and pilot study. CAVE6D: Tele-Immersive tool for visualizing Oceanographic Data
Middleware Technology • Integrated Grid Architecture • Grid Services Infrastructure • Multicast Protocols for Rapid Image Transfer • Analyzing the User of Network Resources
The Grid from a Services View Cosmology Chemistry Environment Applications Nanotechnology Biology Distributed Data- Remote Problem Remote Collaborative Computing Intensive Visualization Solving Instrumentation Application Applications Applications Applications Applications Applications Applications Toolkits Toolkit Toolkit Toolkit Toolkit Toolkit Toolkit Grid Services Resource-independent and application-independent services : (Middleware) E.g., authentication, authorization, resource location, resource allocation, events, accounting, remote data access, information, policy, fault detection Resource-specific implementations of basic services : Grid Fabric E.g., Transport protocols, name servers, differentiated services, CPU schedulers, public key (Resources) infrastructure, site accounting, directory service, OS bypass
Control Text Audio Video Tracking Database and Event Transactions Simulation Data Haptic Drivers Remote Rendering Teleimmersion Networking Requirements • Immersive environment • Sharing of objects and virtual space • Coordinated navigation and discovery • Interactive control and synchronization • Interactive modification of environment • Scalable distribution of environment
High Bandwidth Data Distribution Achieved 35 MBytes/sec.
Midwest Networked CAVE and ImmersaDesk Sites Enabled by EMERGE
CorridorOne Application Campaigns • Approximately two weeks in duration (will do approximately three or four each year) • Focused testing and evaluation of one application area during that time • Involving the participation of external applications scientists • Part of the effort is qualitative to determine how the users will use the remote capabilities • Part of the effort is a set of well designed quantitative experiments to collect data
First Year Milestones • Access Grid nodes up for supporting C1 Collaboration (Oct 31) • Integrate Visualization Tools, Middleware and Display Technologies • Conduct Phase 1 Applications Experiments beginning Dec 1-10 • For each applications domain area we will: • Collect relevant problem datasets and determine possible visualization modalities • Develop remote scientific visualization and analysis scenarios with the end users, • Prototype a distributed collaborative visualization application/demonstration • Test the application locally and remotely with variable numbers of participants and sites • Document how the tools, middleware and network were used and how they performed during the tests • Evaluate the tests and provide feedback to Grid middleware developers, visualization tool builders, and network providers