Download
1 / 95
950 likes | 970 Vues
Lecture 2: Measuring Income and Wealth. Se Yan Guanghua School of Management Peking University Spring 2013. National Income Accounting. Why do we need that? To measure aggregate economic activity Created by Simon Kuznets and Richard Stone Core concept: GDP and GNP

E N D
Lecture 2: Measuring Income and Wealth Se Yan Guanghua School of Management Peking University Spring 2013
National Income Accounting • Why do we need that? • To measure aggregate economic activity • Created by Simon Kuznets and Richard Stone • Core concept: GDP and GNP • The US started publishing GDP in 1947
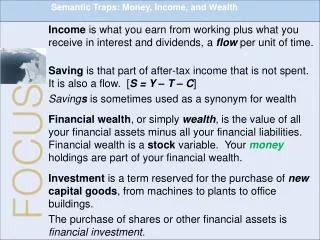
GDP: Gross Domestic Product The total market value of all final goods and services produced within a country in a given period of time.
Market Value • GDP is a market value—goods and services are valued at their market prices. • Non-market activities are not counted as part of GDP! • Household work • Underground economy; illegal economy
Final Goods and Services • A final good (or service), is an item bought by its final user during a specified time period. • A final good contrasts with an intermediate good, which is an item that is produced by one firm, bought by another firm, and used as a component of a final good or service. • Excluding intermediate goods and services avoids double counting.
Produced within a country • GDP measures production within a country—domestic production. • Difference between GDP and GNP • Chinese workers tapping oil in Darfur • Oversea students make money by tutoring Chinese students English
In a given period of time • GDP measures the value of production that takes place within a specific interval of time, usually a year or a quarter (three months). • Antiques, used products • Inventories
Discussions • How will GDP change if a laid-off worker who lived on government subsidy gets employed? • What if you marry your tutor and she continues to tutor you after marriage?
GDP and the Circular Flow of Expenditure and Income • GDP measures the value of production, which also equals total expenditure on final goods and total income earned by all factors of production. • The circular flow diagram illustrates the equality of income, expenditure, and the value of production.
The circular flow diagram shows the transactions among households, firms, governments, and the rest of the world
These transactions take place in factor markets, goods markets, and financial markets.
Firms hire factors of production from households. The blue flow, Y, shows total income paid by firms to households.
Households buy consumer goods and services. The red flow, C, shows consumption expenditures.
Households save, S, and pay taxes, T. Firms borrow some of what households save to finance their investment.
Firms buy capital goods from other firms. The red flow I represents this investment expenditure by firms.
Governments buy goods and services, G, and borrow or repay debt if spending exceeds or is less than taxes
The rest of the world buys goods and services from us, X and sells us goods and services, M; net exports are X - M
And the rest of the world borrows from us or lends to us depending on whether net exports are positive or negative.
The red and blue flows are the circular flow of expenditure and income. The green flows are borrowing and lending.
Aggregate expenditure • The circular flow demonstrates how GDP can be measured in two ways. • Total expenditure on final goods and services, equals the value of output of final goods and services, which is GDP. • Total expenditure = C + I + G + (X – M).
Aggregate Income • Aggregate income earned from production of final goods, Y, equals the total paid out for the use of resources, wages, interest, rent, and profit. • Firms pay out all their receipts from the sale of final goods, so income equals expenditure, • Y = C + I + G + (X – M).
Financial Flow • Financial markets finance deficits and investment. • Household saving S is income minus net taxes and consumption expenditure, and flows to the financial markets; • Y = C + S + T, • income equals the uses of income.
How is investment financed? Investment is financed from three sources: • Private saving, S • Government budget surplus, (T – G) • Borrowing from the rest of the world (M – X).
Investment and Saving • I=S+(T-G)+(M-X) • S is private saving • (T-G) is public saving • National saving is private saving + public saving • Reinterpretation: • S=I+(G-T)+(X-M)
Stocks and Flows A flow is a quantity per unit of time; a stock is the quantity that exists at a point in time. flow stock
GDP accounting: value added method GDP is the market value of all final goods produced within a certain interval Which also equals values added in every step of production
GDP accounting: expenditure method • Y = C + I + G + (X – M).
Consumption The spending by households on goods and services, with the exception of purchases of new housing.
Investment The spending on capital equipment, inventories, and structures, including new housing.
Government Expenditure • The spending on goods and services by local, state, and federal governments. • Does not include transfer payments because they are not made in exchange for currently produced goods or services.
Government Purchases 15% Net Exports -5 % Investment 16% Consumption 70% US GDP and Its Components (2004)
Investment versus Consumption: 1978-2010 Consumption (100 million yuan) Investment (100 million yuan) Consumption/GDP Investment/GDP
China’s Monthly Export and Import ($100m) 2007-01 2008-01 2009-01 2010-01 2011-01 Exports Imports
Income Method: An Example • Bakery making cakes • cakes=f(employment, shop, cake machines, inputs) • Y=GDP=f(N,K) • Sales of cakes=wages + rents + capital rental costs + profits • Y=w*N+r*K+PROFIT
Depreciation • Capital, the plant, equipment, and inventories of raw and semi-finished materials that are used to produce other goods and services is a stock. • Investment is the flow that changes the stock of capital. • Depreciation is the decrease in the capital stock that results from wear and tear, and obsolescence. • Capital consumption is another name for depreciation.
Gross Domestic Product • Gross profits, and GDP, include depreciation. • Similarly, gross investment includes that amount of purchases of new capital goods that replace depreciation • Net profits, net domestic product, and net investment subtract depreciation from the gross concepts. • Investment plays a central role in the economy. Increases in capital are one source of growth in potential real GDP; fluctuations in investment are one source of fluctuations in real GDP.
Decomposition of GNP using Income Method • GNP – depreciation = NNP • NNP – statistical discrepancy = National Income • National Income – indirect business taxes - corporate profits – net interests + dividends + government transfers + personal interest income = Personal Income • Personal Income – Personal Taxes = Disposable Personal Income
Urban and Rural Per Capita Disposable Income: 1978-2010 (in Yuan) Urban Rural
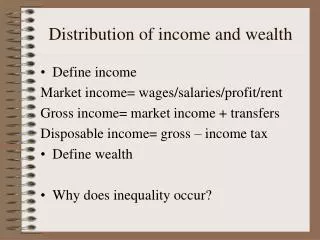
National Income The National Income and Product Accounts divide incomes into five categories • Compensation of employees • Net interest • Rental income • Corporate profits. • Proprietors’ income.
Debates about China GDP Figure • Overestimated? • Electricity produced • Underestimated? • Service sector