Homework Review
240 likes | 259 Vues
Learn how to identify and analyze important characteristics of quadratic functions, such as vertex, axis of symmetry, maximum or minimum, and y-intercept. Understand domain, range, intervals of increase and decrease, rate of change, and end behavior. Practice through graphing exercises.

Homework Review
E N D
Presentation Transcript
Homework Review Lesson 3.1B
Characteristics of Quadratics Unit 5a Day 2
Graphing a Quadratic Function EQ: How do we identify all of the important characteristics of a quadratic? Lesson 3.1B
Today, we are going to begin by reviewing what we have learned yesterday from graphing in vertex form. Lets recall how to find the following: • Vertex • Axis of Symmetry • Maximum or Minimum • Y-intercept
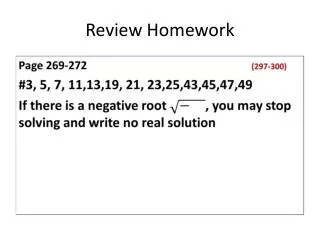
Find: a) vertex b)axis of symmetry c) state whether the vertex is a maximum or minimum. d) y-intercept Shifted up 2 units a) Vertex: (0, 2) b) Axis of symmetry: x = 0 c) Since a > 0 , the parabola opens up and has a: minimum d) y-intercept: (0, 2) 5
Find: a) vertex b) axis of symmetry c) state whether the graph has a maximum or minimum. d) y - intercept Reflected about x-axis Left 2 units Up 4 units a) Vertex: (-2, 4) b) Axis of symmetry: x = -2 c) Since a < 0 , the parabola opens down and has a: maximum d) y-intercept: (0, 0) 6
Domain VS. Range • Domain: (x – values) read domain from left to right • Range: (y-values) read range from bottom to top
The DOMAIN of parabolas is all real numbers… unless the parabola looks like this and has endpoint(s) We say the domain is restricted, therefore it is no longer all real numbers 8
Find the domain of the graph below Domain: -1 < x < 2 9
Find the domain and range of the graph below Domain: -2 < x < 2 Range: 0 < y < 4 10
Find the domain and range of the graph below Domain: -∞ < x < ∞ Range: -∞ < y < 4 11
Graph the quadratic using the axis of symmetry and vertex. Axis of symmetry: Vertex: Y-intercept: Max or Min? maximum Extrema: y = 3 Domain: Range: All real numbers y ≤ 3 12
Graph the quadratic using the axis of symmetry and vertex. Vertex: (-1, 0) Axis of symmetry: Y-intercept: Max or Min? minimum Extrema: y = 0 Domain: Range: All real numbers y ≥ 0 13
Intervals of increase and decrease To determine the intervals of increase and decrease, you must “read” the graph from left to right What are these lines doing from left to right? 14
Let’s apply this idea to parabolas… To determine the intervals of increase and decrease, you must “read” the graph from LEFT to RIGHT What is this parabola doing on the left side of the vertex? What is this parabola doing on the right side of the vertex? Going downhill Going uphill Interval of decrease Interval of increase 15
One more… What is this parabola doing on the left side of the vertex? What is this parabola doing on the right side of the vertex? Going uphill Going downhill Interval of decrease Interval of increase 16
Graph each quadratic function and determine the interval of increase and decrease y = (x+1)²+2 Interval of decrease Interval of increase 17
Graph each quadratic function and determine the interval of increase and decrease Interval of decrease Interval of increase 18
Determine if the given interval is an interval of increase or decrease decrease increase 19
Rate of Change To determine the rate of change, find the slope of the line that passes through two given points on the function. 20
Find the rate of change on the interval: -1≤x≤2 21
End Behavior The value a function, f(x), approaches when x is extremely large (∞) or when x is extremely small (-∞). 22