Download
1 / 31
310 likes | 613 Vues
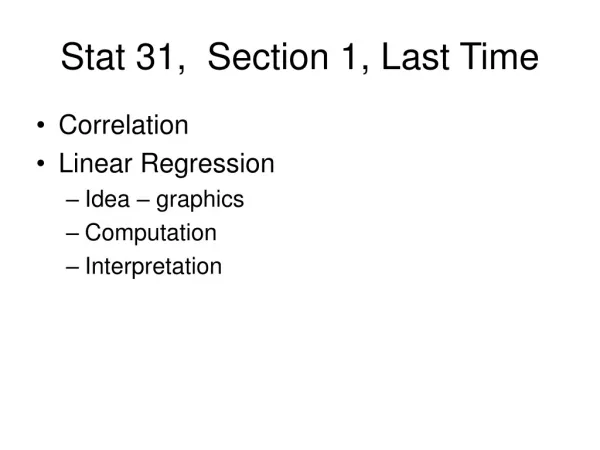
Stat 31, Section 1, Last Time. Correlation Linear Regression Idea – graphics Computation Interpretation. Midterm I. Coming up: Tuesday, Feb. 15 Material: HW Assignments 1 – 4 Extra Office Hours: Mon. Feb. 14, 8:30 – 12:00, 2:00 – 3:30 Bring Along:

E N D
Stat 31, Section 1, Last Time • Correlation • Linear Regression • Idea – graphics • Computation • Interpretation
Midterm I Coming up: Tuesday, Feb. 15 Material: HW Assignments 1 – 4 Extra Office Hours: Mon. Feb. 14, 8:30 – 12:00, 2:00 – 3:30 Bring Along: 1 8.5” x 11” sheet of paper with formulas (front & back OK, but no newspapers)
Chapter 3: Producing Data (how this is done is critical to conclusions) Section 3.1: Statistical Settings 2 Main Types: • Observational Study Simply “see what happens, no intervention” (to individuals or variables of interest) e.g. Political Polls, Supermarket Scanners
Producing Data 2 Main Types: • Observational Study • Experiment (Make Changes, & Study Effect) Apply “treatment” to individuals & measure “responses” e.g. Clinical trials for drugs, agricultural trials (safe? effective?) (max yield?)
Producing Data 2 Main Types: • Observational Study • Experiment (common sense) Caution: Thinking is required for each. Both if you do statistics & if you need to understand somebody else’s results
Producing Data 2 Main Types: • Observational Study • Experiment (common sense) Caution: Thinking is required for each Both if you do statistics & if you need to understand somebody else’s results
Helpful Distinctions (Critical Issue of “Good” vs. “Bad”) • Observational Studies: • Anecdotal Evidence Idea: Study just a few cases Problem: may not be representative (or worse: only considered for this reason) e.g. Cures for hiccups Key Question: how were data chosen? (early medicine: this gave crazy attempts at cures)
Helpful Distinctions • Observational Studies: B. Sampling Idea: Seek sample representative of population HW: (old) 3.1, 3.3, 3.5, 3.7 Challenge: How to sample? (turns out: not easy)
How to sample? History of Presidential Election Polls During Campaigns, constantly hear in news “polls say …” How good are these? Why? • Landon vs. Roosevelt Literary Digest Poll: 43% for R Result: 62% for R What happened? Sample size not big enough? 2.4 million Biggest Poll ever done (before or since)
Bias in Sampling Bias: Systematically favoring one outcome (need to think carefully) Selection Bias: Addresses from L. D. readers, phone books, club memberships (representative of population?) Non-Response Bias: Return-mail survey (who had time?)
Bias in Sampling • Presidential Election (cont.) Interesting Alternative Poll: Gallup: 56% for R (sample size ~ 50,000) Gallup of L.D. 44% for R ( ~ 3,000) Predicted both correct result (62% for R), and L. D. error (43% for R)! (what was better?)
Improved Sampling Gallup’s Improvements: • Personal Interviews (attacks non-response bias) (ii) Quota Sampling (attacks selection bias)
Quota Sampling Idea: make “sample like population” So surveyor chooses people to give: • Right % male • Right % “young” • Right % “blue collar” • … This worked well, until …
How to sample? • Dewey Truman sample size Crossley 50% 45% Gallup 50% 44% 50,000 Roper 53% 38% 15,000 Actual 45% 50% - Note: Embarassing for polls, famous photo of Truman + Headline “Dewey Wins”
What went wrong? Problem: Unintentional Bias (surveyors understood bias, but still made choices) Lesson: Human Choice can not give a Representative Sample Surprising Improvement: Random Sampling Now called “scientific sampling” Random = Scientific???
Random Sampling Key Idea: “random error” is smaller than “unintentional bias”, for large enough sample sizes How large? Current sample sizes: ~1,000 - 3,000 Note: now << 50,000 used in 1948. So surveys are much cheaper (thus many more done now….)
Random Sampling How Accurate? • Can (& will) calculate using “probability” • Justifies term “scientific sampling” • 2nd improvement over quota sampling
Random Sampling What is random? Simple Random Sampling: Each member of population is equally likely to be in sample Key Idea: Different from “just choose some”
Random Sampling An old (but still fun?) experiment: Choose a number among 1,2,3,4 Old typical results: about 70% choose “3” (perhaps you have seen this before…) Main lesson: human choice does not give “equally likely” (i.e. random sample)
Random Sampling How to choose a random sample? Old Approaches: • Random Number Table • Roll Dice Modern Approach: • Computer Generated
Random Sampling EXCEL generation of random samples: https://www.unc.edu/~marron/UNCstat31-2005/Stat31Eg15.xls Goal 1: Generate Random Numbers EXCEL approaches: • RAND function • Tools Data Analysis Random Number Generation
EXCEL Random Sampling Goal 2: Randomly Reorder List EXCEL approach: • Highlight block with list & random num’s • Sort whole thing on numbers Goal 3: Random Sample from List • Choose 1st subset from random re-order • Since, each equally likely in each spot
EXCEL Details RAND: • Not available among “Statistical” functions • But can find on “All” menu • Note no (explicit) inputs • Just put in desired cell • Drag downwards for several random #s • Caution: these change on each re-comp. • Thus not recommended for this
EXCEL Details Tools Data Analysis Random Number Generation : • Set: # Variables: 1 Distribution: Uniform (over [0,1]) • Generates Fixed List (doesn’t change with re-computation) (note entries are “just numbers”) • Thus stable for later interpretation • Recommended for random sample choice
EXCEL Details Sorting Lists: • Highlight Block with Both: • Names to sort • Random numbers • Data Sort Choose Column • Result is random re-ordering of List
Random Sampling HW HW: C8: For the letters A – L, use EXCEL to: (a) Put in a random order. (b) Choose a random sample of 6. (Hints: for (a), want each equally likely, for (b), reorder, and choose a subset)
Random Sampling HW Interesting Question: What is the % of Male Students at UNC? (Your chance of date, or take 100% - to get your chance) HW: C9: Print Class Handout https://www.unc.edu/~marron/UNCstat31-2005/Stat31HWC9.doc
Random Sampling HW Notes on HW C9: • 3 dumb ways to sample, 1 good one • Goal is to learn about sampling, Not “get right answer” • Part 1, put symbol for yourself, Ms and Fs for others • Put both count & % (%100 x count / 25) • Part 2, “tally” is: • Part 4, student phone directory available in Student Union?
Random Sampling HW Notes on HW C9, • Hints on Part 4: • For each draw, first draw a “random page” • Tools Data Analysis Random Number Generation Uniform is one way to do this • In “Uniform”, you need to set “Parameters”, to 0 and “number of pages”. • This gives a random decimal, to get an integer, round up, using CEILING • In CEILING, set “significance” to 1.
Random Sampling HW Notes on HW C9, • Hints on Part 4 (cont.): • Next Choose Random Column • Next Choose Random Name • Caution: Different numbers on each page. • Challenge: still make equally likely • Approach: choose larger number. • Approach: when not there, just toss it out • Approach: then do a “redraw” • Also redraw if can’t tell gender
More On Surveys More Common Sense: How you ask the question makes a big difference HW: 3.55, 3.57