Level of Service Analysis
120 likes | 293 Vues
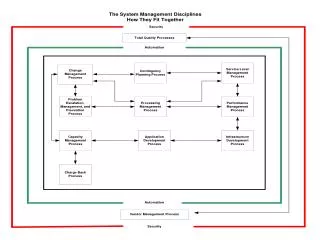
Level of Service Analysis. Joe Kern, SRF Consulting Group, Inc. Process Flowchart. Process Flowchart. Population Characteristics. Trip Rates by Markets. Current Passenger Demand*. Future Passenger Demand**. Service Hrs to Meet Future Demand**. Unit: passengers. Unit: passengers.

Level of Service Analysis
E N D
Presentation Transcript
Level of Service Analysis Joe Kern, SRF Consulting Group, Inc.
Process Flowchart Process Flowchart Population Characteristics Trip Rates by Markets Current Passenger Demand* Future Passenger Demand** Service Hrs to Meet Future Demand** Unit: passengers Unit: passengers Current Productivity Levels Unit: rev hrs Cost to Meet Future Needs Unit Costs Unit: passengers/hr Target Rates Level of Needs Currently Met Population Unit: $$ Service Hrs to Meet Idealized Service Levels** Current Service Availability* Future Levels of Service ** Unit: rev hrs Unit: rev hrs Unit: rev hrs *By System **By County
Level of Service • Basis for analysis • Land area and road miles per county unlikely to change in future • Population is the most reasonable basis to use as state demographer generates for each county
Level of Service • Primary analysis variable is revenue hours per capita by system peer group • Large urbanized • Small urban • Rural
Gap in Unmet Demand Can be Filled by: • Increasing revenue hours of service with no change in productivity • Increasing productivity within same amount of service (revenue hours) • Combination of 1. and 2.
Recent Trends (2005 to 2008) • Passengers per capita (increased 20-30%, more in rural) • Revenue hours per capita (increased 20%) • Passengers per revenue hour (little change, except in rural)
Recommendations • Since passengers per revenue hour did not change significantly for major peer groups during 2005 to 2008, it is unlikely that we could expect to see significant increases in future years when trying to fill unmet needs gap • It is recommended that increased service levels as measured by revenue hours per capita be used as the future year target variable for the LOS analysis
Recommendations • Target rates (revenue hours per capita) to be developed for: • Large urban (Duluth, Rochester, St. Cloud) • Medium urban (Mankato, Moorhead) • Small urban (over 10,000 population) • Rural