Download
1 / 16
160 likes | 183 Vues
Appropriate Collection, Use and Representation of Data in an Introductory Lab. Introduction to Oceanography Lecture (3-credit hours) Started in 2008 First OCE class at DSC Meets State of Florida Gen Ed Requirements No lab requirement. Created in 2010 Four AA Transfer Tracks Marine Science

E N D
Appropriate Collection, Use and Representation of Data in an Introductory Lab
Introduction to Oceanography Lecture (3-credit hours) • Started in 2008 • First OCE class at DSC • Meets State of Florida Gen Ed Requirements • No lab requirement
Created in 2010 • Four AA Transfer Tracks • Marine Science • Marine Biology • Environmental Science • Ocean Engineering Student enrollment >200
OCE1001 Lab • Started in Fall, 2013 • Limited enrollment • Designed specifically for AA Transfer Students • 16 maximum • Field intensive • Requires Independent Research Project (IRP) • Completed in one semester
OCE1001 Lab Lab Goals • Strengthen student skills • Increase student confidence • Prepare students and make them more competitive for transfer • Increase student retention • Hopefully recruitment! • REMAIN WITHIN GEN ED GUIDELINES!
OCE1001 Lab Data Representation • Week 1 • Graphing I • The problem with data • How do I choose the right graph? • 1st Excel exercise
OCE1001 Lab Data Representation • Week 1 • Graphing I • The problem with data • How do I choose the right graph? • 1st Excel exercise
OCE1001 Lab Data Representation • Week 1 • Graphing I • The problem with data • How do I choose the right graph? • 1st Excel exercises
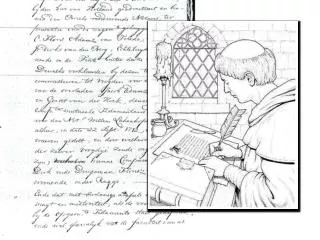
OCE1001 Lab Data Representation • Week 1 • Graphing I • Field Notebooks!
OCE1001 Lab Data Representation • Week 2 • Graphing II • 2nd Excel exercise • Work in groups • Examine data • Identify variables • Create Scientific Question • Choose graph type • Suggest title, axis labels
OCE1001 Lab Data Representation • Week 2 • Graphing II • 2nd Excel exercise • Enter the data • Use Excel to calculate total, Avg and StDev., etc. • Submit Excel • Copy/paste into Word, PowerPoint • Save as pic file • IRP Prep
OCE1001 Lab Data Representation • Week 3 • Graphing II • Respectful Review • Peer Review of Student Graphs
OCE1001 Lab Collection and Use • Weeks 3+ • Field/Lab Exercises • Pose Scientific Question • ID Appropriate Graph • Collect Data • Graph and Interpret
OCE1001 Lab Collection and Use • Week 8 • IRP • Mid-term Presentation • 5 minutes • Peer Reviewed • Scientific Question • Materials • Methods • Graph(s)
OCE1001 Lab Collection and Use • Final Week • IRP • Final Presentation • 15 minutes • Peer reviewed
OCE1001 Lab Examples of Student IRPs • The use of fish otoliths for environmental assessments • Problems with Florida’s ocean plastics • Ocean acidification and impact on coral • Developing a method to measure tidal current velocity for renewable energy • Water quality impacts on sea grass