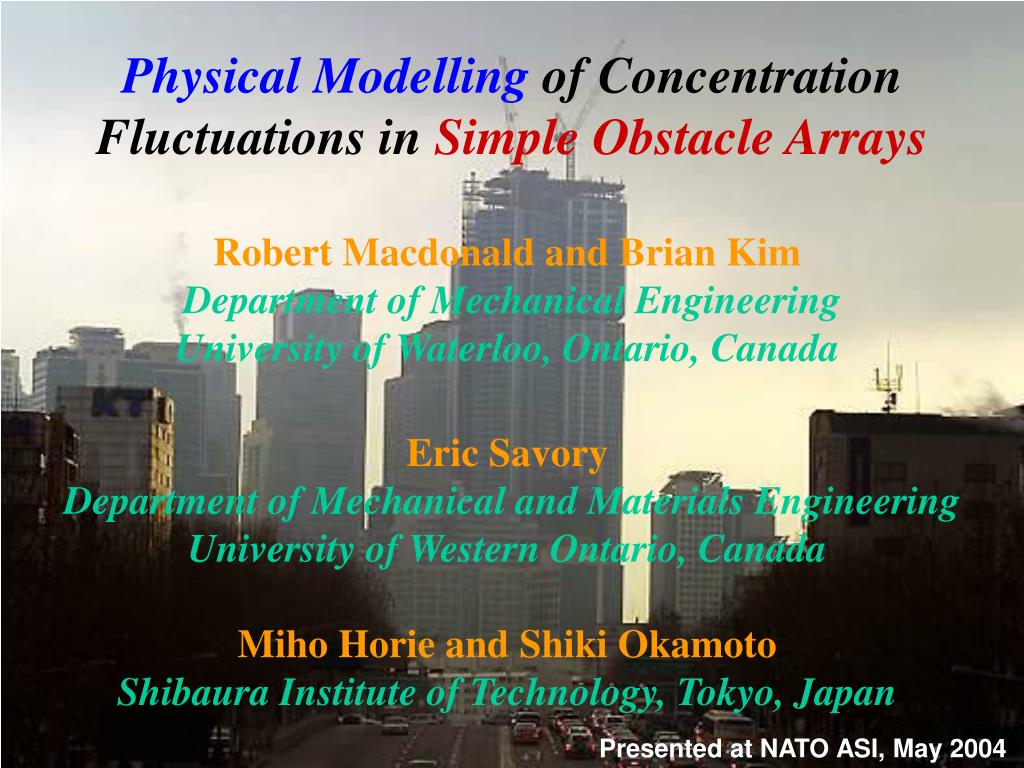
Physical Modelling of Concentration Fluctuation s in Simple Obstacle Arrays. Robert Macdonald and Brian Kim Department of Mechanical Engineering University of Waterloo, Ontario, Canada Eric Savory Department of Mechanical and Materials Engineering University of Western Ontario, Canada
01 / 56Physical Modelling of Concentration Fluctuation s in Simple Obstacle Arrays
1 / 17
Télécharger la présentation
Physical Modelling of Concentration Fluctuation s in Simple Obstacle Arrays
Une image / un lien ci-dessous est fourni (tel quel) pour télécharger la présentation
Politique de téléchargement : le contenu du site vous est fourni TEL QUEL pour votre information et votre usage personnel ; il ne peut être vendu, concédé sous licence ni partagé sur d’autres sites sans l’accord de son auteur.Le contenu vous est fourni TEL QUEL, pour votre information et votre usage personnel uniquement.Téléchargez la présentation en cliquant sur ce lien.Lors du téléchargement, si vous ne parvenez pas à télécharger une présentation, l’éditeur a peut-être supprimé le fichier de son serveur.Pendant le téléchargement, si vous ne parvenez pas à obtenir une présentation, le fichier a peut-être été supprimé par l’éditeur.
F I N
Plus de contenu associé
Transcription de la présentation
Physical Modelling of Concentration Fluctuations in Simple Obstacle Arrays Robert Macdonald and Brian Kim Department of Mechanical Engineering University of Waterloo, Ontario, Canada Eric Savory Department of Mechanical and Materials Engineering University of Western Ontario, Canada Miho Horie and Shiki Okamoto Shibaura Institute of Technology, Tokyo, Japan Presented at NATO ASI, May 2004
Content • Background • Description of the physical modelling facility - Hydraulic flume - Atmospheric boundary layer simulation - Obstacle arrays • Planar Laser Induced Fluorescence (PLIF) technique for concentration measurements • Discussion of results for - Mean concentrations - RMS concentration fluctuations • Conclusions
Air Pollutants • Local stack plumes • Exhausts from automobiles • Accidental Releases
Street Canyon • Geometry created bya narrow street with • buildings lined upcontinuously along both • sides (Nicholson, 1975) • The canyon flow is affected bythe arrangement • and spacing between the buildings
Background Concentration fluctuations can be important in assessing toxic risk. Experimental data on concentration fluctuations in obstacle arrays is quite sparse. It has been suggested that Crms is O(Cmean) but estimates vary greatly. The present study seeks to quantify Crms / Cmean for different obstacle arrays and downwind locations.
Objectives • Obtain concentration profiles using PLIF technique in a water flume • Determine the effects of obstacle configuration on mean dispersion parameters (max. concentration, plume height, etc.) • Obtain relative concentration fluctuation intensity profiles • Validation of PLIF application
Scale Modeling • Full-scale (field) and Small-scale Studies • 10 m : 5 cm = 200 : 1
Hydraulic Flume Fully developed, turbulent approach flow (10cm/sec) Experimental Facilities (I) 2.4 m - Flume dimensions: 12.6 m x 1.2 m x 0.8 m
Light Source System Argon ion Laser (Maximum, 5W) Fixed frequency resonant optical scanner 1 mm Light sheet Experimental Facilities (II)
Approach Flow Characterization • Acoustic Doppler Velocimeter (ADV: 20 Hz) Reference Height (5cm) Zo = 0.20 mm (0.4 m FS) UH = 5.74 m/s U* / UH = 0.13 = 0.29 Suburban terrain
Dispersion Parameter (I) • Non-Dimensional Concentration (Kc) • Can be directly • compared with • non-dimensional data • from • field-scale experiments • or • dispersion data from • other wind tunnel • facilities Where CN = C/Cs Q = Volume flow rate UH = Velocity at H (5cm) Cs = Source conc.
DispersionParameter (II) Reference : Lecture Not (Air Pollution) Z/H • Net vertical plume variance Vertical rise of the plume is a combination of two factors; The centre of the distribution Zc and the standard deviation of the distribution sZ z/H C (z)
Experimental Configuration (II) • Unobstructed plume - Less dilution than in the obstacle arrays higher concentrations - A baseline case for comparison to the obstacle (building) array results “Lego” roughness Nuts
Experimental Configuration (III) • 2-Dimensional with different Area Density AF = Frontal area AT = Total plan area 0.5 H 1.5 H H2 / (2.5Hx2.5H) = 16% H2 / (1.5Hx1.5H) = 44%
Previous work with these arrays • ADV measurements of mean velocity and turbulence quantities, Carter (2000), Macdonald et al (2002). • Correlation of turbulence quantities above obstacles with: u / U* = 2.10, v / U* = 1.65 and w / U* = 1.20. • Peak TKE about 30% greater above staggered array when compared to square array. • Value of about 50% larger for flat plate arrays compared to cube arrays.
The basic PLIF system Planar laser light source Fluorescent tracer release system Digital image acquisition and storage system Digital image analysis software PLIF Components 1 2 3 4
PLIF Principle • The higher the concentration (C)of dye, the greater the intensity of emitted light (E)for a given intensity ofincident light (I): • = calibration const. • (e.g. Crimaldi & Koseff, 2001) • Allows measurement of the spatial distribution of tracer concentrations Inside test section of water flume
Calibration • PLIFtechnique requires a careful calibration to • convert image intensity to concentration. 0.5 0.25 0.1 0.05 (ppm) KNOWN Concentration • To obtain the actual concentration, a calibration • box was used with known concentrations of dye • to form a calibration curve
Set-Up Experiment Configuration Image Grabbing Image Recording In each ROI Calculating Concentration With Calibration Calibration Box Image Record Collecting Concentration Profile Data Data Analysis Procedure Experimental Work Image processing Data Analysis Mean Concentration Using Gaussian C.Fit Extract Dispersion Parameter Analysis Of Relative Concentration
Results • Mean Concentration Profiles • Non-Dimensional Concentration • Analysis of characteristics for the various area densities and configurations • Concentration fluctuation profiles
Averaging Partitioning • Mean concentration profiles - Each canyon was divided into 5 sections Mean Concentration Image
20 pixels 0.0077(at Z/H=0.7) Average • Spatial Averaged Concentration - Upstream Staggered 1st Canyon Example 20 pixels 100 pixels
4 1 2 3 4 6 G 1 2 G 2 G 4 G 6 1 0 0 0.1 0.2 0.3 0.15 0.25 0.05 • Mean concentration profile fitted with Gaussian curve Z / H (ppm) C(z)
Summary of considerations • Saturation, Attenuation, Non-linear regression , Distortion, Reflection, Images for analyzing • Control Factors • Source concentration (24.5 ppm) • Small aperture (narrow field of view) • Weak dye ( C <= max ~ 0.5 ppm) • Gaussian curve fitting parameters • Maximum length of camera position (3.8 m) • Painting all blocks black • 5 minute sampling with 20 images is optimal 0.5 ppm
I. Comparison of dispersion parameters (Kc, Zbar) with Wind tunnel and Point measurement data • Different configuration for two experiments • 1. Wind T : Ground level release • Point measurement at centre • of canyon • 2. Flume : 0.5 H release,at centre of canyon
Upstream Square 16 % Relative Concentration Profiles • The peak of the relative concentration fluctuation intensity (Crms/Cmean) occurs in the mixing layer immediately above the obstacles • The ratio (Crms/Cmean) decreases rapidly below rooftop height.
Connexion au compte
Connectez-vous pour publier votre contenu sur SlideServe.