
SlideServe
Menu
Préférences
© SlideServe · v2026

Advanced Analysis of Historical Stock Volatility and Price Changes Using AmiBroker

janina avatar
40 diapositives · 553 Views · Aug 24, 2014

This document outlines a sophisticated method for analyzing historical volatility levels of stocks. The process involves collecting historical data, sorting stocks into bins based on volatility, and calculating mean daily price changes for stocks within these bins. This analysis leads to a piecewise linear approximation of daily price change per volatility level. The calculations are tailored using R parameters and performed through AmiBroker, a leading technical analysis software, providing insights into market behaviors and trends.
Advanced Analysis of Historical Stock Volatility and Price Changes Using AmiBroker - slide 1
01 / 40Advanced Analysis of Historical Stock Volatility and Price Changes Using AmiBroker
1 / 17

Télécharger la présentation

Advanced Analysis of Historical Stock Volatility and Price Changes Using AmiBroker
Une image / un lien ci-dessous est fourni (tel quel) pour télécharger la présentation

Politique de téléchargement : le contenu du site vous est fourni TEL QUEL pour votre information et votre usage personnel ; il ne peut être vendu, concédé sous licence ni partagé sur d’autres sites sans l’accord de son auteur.Le contenu vous est fourni TEL QUEL, pour votre information et votre usage personnel uniquement. Téléchargez la présentation en cliquant sur ce lien. Lors du téléchargement, si vous ne parvenez pas à télécharger une présentation, l’éditeur a peut-être supprimé le fichier de son serveur.Pendant le téléchargement, si vous ne parvenez pas à obtenir une présentation, le fichier a peut-être été supprimé par l’éditeur.

F I N

Plus de contenu associé

Transcription de la présentation
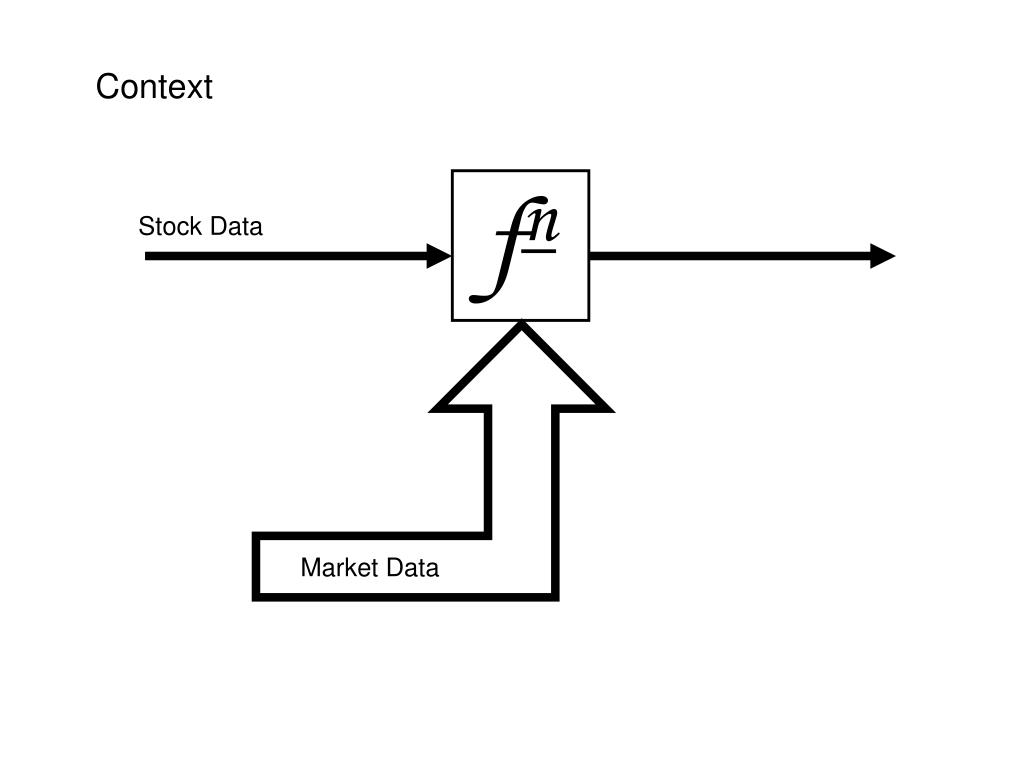
  1. Context fn Stock Data Market Data

  2. 0

  3. Price Industry Groups Fundamentals

  4. Beta K Price

  5. Beta K Price

  6. Pass 1 Collect historical volatility levels of each stock, sort stocks into bins Pass 2 Calculate mean daily price change for stocks in each bin Pass 3 Calculate two separate means price changes, one for above mean and one for below Return Final Calculation Construct piecewise linear approximation of daily price change per volatility Increasing Historical Volatility

  7. +1 Return 0 -1 Increasing Historical Volatility

  8. 0.180 GE - adjust R param 0.090 0.00435257 0.000 -0.00060 -0.00783725 -0.090 -0.180 Created with AmiBroker - advanced charting and technical analysis software. http://www.amibroker.com

  9. 0.180 GE - adjust R param 0.090 0.00611642 0.000 -0.00806698 -0.0224485 -0.090 -0.180 Created with AmiBroker - advanced charting and technical analysis software. http://www.amibroker.com

  10. 0.180 GE - adjust R param 0.090 0.0125319 0.000 -0.00839436 -0.0297501 -0.090 -0.180 Created with AmiBroker - advanced charting and technical analysis software. http://www.amibroker.com

  11. 0.180 GE - adjust R param 0.090 0.0217459 0.000 -0.00650727 -0.0334761 -0.090 -0.180 Created with AmiBroker - advanced charting and technical analysis software. http://www.amibroker.com

  12. 0.180 GE - adjust R param 0.090 0.0340311 0.000 -0.00399114 -0.0384442 -0.090 -0.180 Created with AmiBroker - advanced charting and technical analysis software. http://www.amibroker.com

  13. 0.180 GE - adjust R param 0.090 0.0493876 0.000 -0.00085 -0.0446542 -0.090 -0.180 Created with AmiBroker - advanced charting and technical analysis software. http://www.amibroker.com

  14. 0.180 GE - adjust R param 0.090 0.0647441 0.00229917 0.000 -0.0508642 -0.090 -0.180 Created with AmiBroker - advanced charting and technical analysis software. http://www.amibroker.com

  15. 0.180 GE - adjust R param 0.0923858 0.090 0.00796045 0.000 -0.0620423 -0.090 -0.180 Created with AmiBroker - advanced charting and technical analysis software. http://www.amibroker.com

  16. Close only

  17. Relative Volatility only

  18. Dollar Volume

  19. Dollar Volume + relative volatility

  20. Conclusions IFTA ‘05 ~FIN~