Download
1 / 3
30 likes | 126 Vues
Histogram How often is the furniture rearranged in your home?. Pie Chart W hat type of chair do you like to sit in when you read?. Box & Whisker How many chairs are in your home?. Furniture in Our Homes. http://people.hofstra.edu/Stefan_Waner/stats/histogram.html.

E N D
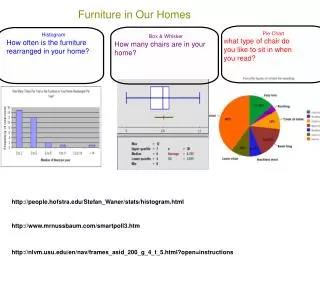
Histogram How often is the furniture rearranged in your home? Pie Chart What type of chair do you like to sit in when you read? Box & Whisker How many chairs are in your home? Furniture in Our Homes http://people.hofstra.edu/Stefan_Waner/stats/histogram.html http://www.mrnussbaum.com/smartpoll3.htm http://nlvm.usu.edu/en/nav/frames_asid_200_g_4_t_5.html?open=instructions
Data Analysis Poster Project 1) Pick one theme for your poster. 2)Develop a survey on your theme at Flisti.com with interval responses that can be organized into a histogram for your poster. 3)Write your survey number on your class chart under histogram and in your planner. 4)Develop a second survey on the same theme at Flisti.com with single number responses that can be organized into a box and whisker plot for your poster. 5) Write your survey number on your class chart under box and whisker plot and in your planner. 6)Develop a third survey on the same theme at Flisti.com with category word responses that can be organized into a pie chart for your poster. 7) Write your survey number on your class chart under pie chart and in your planner. 8)Create a poster to display your data and be prepared to share your data analysis with the class. 9) Helpful websites: Flisti.com http://people.hofstra.edu/Stefan_Waner/stats/histogram.html http://www.mrnussbaum.com/smartpoll3.htm http://nlvm.usu.edu/en/nav/frames_asid_200_g_4_t_5.html?open=instructions