Download
1 / 27
270 likes | 383 Vues
Visualizing RDF(s)-based Information. Alexandru Telea , Flavius Frasincar, Geert-Jan Houben Eindhoven University of Technology , t he Netherlands. Overview. What is RFD(s) data Visualizing RDF(s) data The Gviz tool Applications Conclusions. Node Type. Value.

E N D
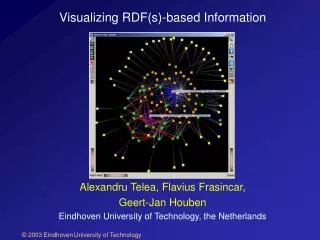
Visualizing RDF(s)-based Information Alexandru Telea, Flavius Frasincar, Geert-Jan Houben Eindhoven University of Technology, the Netherlands
Overview • What is RFD(s) data • Visualizing RDF(s) data • The Gviz tool • Applications • Conclusions
Node Type Value named resource URI anonymous resource - literal name Edge Type Value property URI What is RDF(s) data? RDF: resource description framework (http://www.w3.org) • foundation for exchanging metadata • describes web resources • two graphs: instance and schema
Questions and Requirements • understand and modify the RDF(s) data • understand: RDF(s) data = graphs graph understanding visualization • modify: graph editing • typical questions: how is a RDF(s) dataset looking? does an instance match a schema? how does an instance evolve? how does a schema evolve? need for visual graph analysis/editing tools
1 Previous Work Text-based tools: Protégé-2000 ‘Newspaper’ example: list of articles, sections, employees, advertising in a fictitious newspaper. • text-only • insightful only for small datasets • not easy to add ‘what-if’ queries and scenarios
2 Previous Work Visual tools: RDFSViz visualization tool Uses AT&T GraphViz’s graph drawing to display RDF data Limited to directed DAG drawing layouts • visual • insightful only for small datasets • not easy to add ‘what-if’ queries and scenarios
3 Previous Work Visual tools: OntoViz plugin for Protégé Enhances Protégé with graph drawing capabilities Same (limited) directed layout as RDFSViz
4 Previous Work Visual tools: IsaViz • visual • set of graph editing tools • insightful only for small datasets • not easy to add ‘what-if’ queries and scenarios
Goal • Provide a visual examination and editing tool for • RDF(s) data that: • copes with realistically large datasets • allows an easy definition of new queries • allows an easy definition of new visualizations (layouts, coloring schemes and shapes, etc) • Can we reuse/adapt an existing tool?
The GViz Tool • first used in the context of reverse engineering (thus handles large graphs) (VisSym’02, IWPC’02, TOOLSEE ’02) • generic data and operation model • allows end-user customization of all operations: • - selection: what to display • - layout: how to arrange • - glyphs: what to draw • - interaction: how to respond
GViz Architecture Overview RDF(s) data input selected data query displayed data display & interaction
initial data GViz Operation Pipeline layout 2 (dot) layout 1 (GEM) type-colored glyphs selected subset selected subset 2 ... other operations …
Newspaper Example - Comparison GViz IsaViz Nodes Edges yellow: literals red: subclassOf green: resources blue: type white: others orange: nodes with a Property edge
Applications • customizable selections • schema-instance comparisons- how/what of a schema is instanced • instances comparison- how do two instances (of same schema)differ • schemas comparison • - how do two schemas differ (e.g. schema evolution) graph comparison operations (done only for non-anonymous nodes)
Applications RDF(s) work data: User Agent Profiles (UAProf) = RDF(s) datasets describing mobile phone capabilities literals resources Example: UAProf schema nodes with a Property edge (towards literals) subclassOf edges
Customizable selections user clicks this component full schema only edges from/to clicked component customizing selection script: 18 Tcl lines customizing glyphs script: 40 Tcl lines
Most instance-specific nodes are literals (yellow, ) Only the (few) component-types are instantiated (red, ) Many uninstantiated properties (green) Schema-instance comparison Nokia 8310 instance schema instance vs schema Use shape for type: named literals anonymous Use color for comparison: instance schema common
Instance-instance comparison Color usage instance specific Ericsson only all four phones similar overall structure Two Ericssons moresimilar than rest specific: literals, e.g.phone name, etc. Only one commonresource found!This led to discoveringan inconsistent namingscheme betweendatasets
Schema-schema comparison 2000 2001 Color usage schema specific 2000, 2001 only 2001, 2002 only all years little gray in (2000,2001), soschemas are very similar 2001 2002 no yellow!!! so nothing onlyin 2001 and 2002 enough red in (2001,2002), sopart common to all years kept 2002 is a new product family which breaks the 2000-2001 continuity
1 2 3 Conclusions Combination of customizable selections, glyphs,layouts, and interaction is very effective for understanding RDF(s) datasets • Facts found by visualization (and previously unknown): • naming scheme changes • mobile phone instances for different schemas are similar • product family breakpoint in schema evolution • Effort needed to adapt Gviz tool to RDF(s) data & tasks: • 10-40 Tcl lines per task • 30 minutes for the first task, 5-10 minutes afterwards • No need to develop new tool
4 Conclusions A flexible graph visualization tool allowing easy end-usercustomization of most operations is essential Spring-embedder layouts more effective than directed trees/DAGs if combined with selection and glyphs 5 • Need to look at • RDF(s) data editing • metrics for selection and glyph parametrization 6
Appendix: Mapping and Visualization Map ‘abstract’ graph data to ‘concrete’ visual form Mapping and visualization pipeline
graph data Glyph factory mapper glyphs viewer 1 2 3 4 Appendix: Mapping and Visualization Basic Mapping mappers data->2D/3D geometries viewers geometries->display glyphs parameters->geometries glyph factories attributes->parameters
Appendix: Mapping and Visualization Glyphs •similar to the SciVis glyphs •2D/3D parametrizable graphical objects •implemented as (small) Inventor scene graphs Glyph Factories •called by mappers for each node/edge to map •written as (small) Tcl scripts, thus very easy to customize •selectable/editable at run-time to map data in various ways
Appendix: Mapping and Visualization Advantages of the chosen architecture: •easy to produce different mappings on the fly (average Tcl glyph factory < 15 lines of code) •flexible (control mapping at node/edge level) •simple to implement (2 mappers vs >20 in SciViz) •adding more complex mappers could e.g. produce UML-like diagrams automatically