Download
1 / 27
270 likes | 344 Vues
Agricultural landscapes consist of changing land uses and linear elements like hedgerows and roads that affect catchment hydrology and water quality. This study introduces a plot tree structure to map flow pathways and identify critical source areas. The method involves identifying inlets and outlets on fields, creating a drainage network, and calculating relative contributing areas. The plot tree represents surface flow relationships and highlights potential erosion risk areas. Applications include identifying critical source areas for erosion and modeling pollutant fluxes to evaluate land use effects on water contamination.

E N D
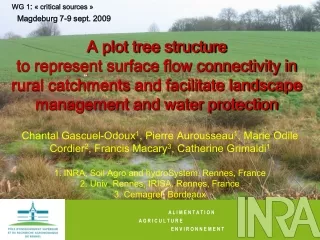
WG 1: « critical sources » Magdeburg 7-9 sept. 2009 A plot tree structure to represent surface flow connectivity in rural catchments and facilitate landscape management and water protection • Chantal Gascuel-Odoux1, Pierre Aurousseau1, Marie Odile Cordier2, Francis Macary3, Catherine Grimaldi1 • 1. INRA, Soil Agro and hydroSystem, Rennes, France • 2. Univ. Rennes, IRISA, Rennes, France • 3. Cemagref, Bordeaux A L I M E N T A T I O N A G R I C U L T U R E E N V I R O N N E M E N T
Agricultural landscapes are structured • by a mosaic of farmers’fields whose land use change over time • by linear elements such as hedgerows, ditches and roads (boundaries, interface) which are more or less connected to each other and to the fields • Such man-made features are now well known to have an effect on catchment hydrology, erosion and water quality, acting as sink or sources • In such agricultural landscapes, as necessary step for improving landscape design and water protection, it is crucial to have • an adequate representation of the flow pathways and • relevant indicators of surface flow connectivity over the catchment towards the stream
How to take into account the flow pathways and therefore identify critical source areas ?
1. Method Aurousseau P., Gascuel-Odoux C., et al., 2009 A plot drainage network as a conceptual tool for the spatialisation of surface flow pathways for agricultural catchments. Computer and Geosciences, 35, 276-288.
E F D Riv 104 102 102 103 Plot 1 Outlet 2 Outlet 1 G 100 C 101 102 101 98 101 98 101 Plot 2 Outlet 3 A 94 97 96 93 B Identifying the inlets and outlets on each field Deducing a drainage network composed of a set of elementary plot outlet trees labelled by attributes, particularly surface areas Estimating the relative areas contributing to any outlet Inside one plot, hydrological areas are delineated regarding its outlets
If present, linear networks such as hedges, road,…modify this tree structure, by adding functions • Wall: redirect the flowpath ways • Walls crossing ou Sink: can isolate a part of catchment area Applied fo hedge rows and roads Road acts as a ditch Road acts as a wall Neutral road
ArcGIS MNTsurf • GIS database of the landscape • Plot Plan • Hydrographic network • Hedge row network • Road network DEM Drainage network Raster representation of the landscape Drainage network modified by: • Hydrological network • Hedge row network • Road network Topographic drainage network Plot outlet tree network The global plot outlet tree represent a pattern of surface flow relationships and constitutes a landscape drainage network
Village Large field area Therefore, only a part of the surface area of the catchment is effectively connected to the stream The global plot outlet tree represents the pattern of surface flow relationships over the catchment. Entire or part of plots are disconnected
Statistics on the plot connectivityThe small plot outlet trees are numerousThe great part of the surface area is composed of middle size plot outlet tree This can be usefull to compare different catchments
This landscape drainage network greatly reduces the number of objects in comparison with a drainage network made up of pixels or DEM cells. • It provides a simple and appropriate way of representing the surface flow connectivity from plot to plot over the catchment, which leads to a functional display of data for decision support. • It allows us to highlight the plots of potential risk regarding the surface runoff
2. Applications to identify critical source areas for erosion Gascuel-Odoux C., et al., in review Hydrological Processes • A catchment presenting • High baseflow erosion (40%) • High density of hedge • Grassland • Assumption : riparian érosion ? Lefrançois J, Grimaldi C et al, 2007. Hydrological Processes.
The hedge row and road networks are highly developed, and therefore, reduce the effective contributing area to the stream
When considering the landuse • Sink: on grassland and forested areas Taking into account landuse improve the identification of critical areas
The connected areas are low extended (7% of the surface area) and close to the stream, indicating that the suspended sediment come from riparian areas in this catchment Some upslope plots are connected to the stream by the way of artificial areas which can play a major role in connecting upslope arable areas We can easily identify the hot points of source of erosion : they are few numerous
3. Modelling surface runoff and pollutant fluxes Gascuel-Odoux C, Cordier MO, et al., 2009 A decision-oriented model to evaluate the effect of land use and management on herbicide contamination in stream water. Environmental modelling and software, Modelling surface and subsurface flow Stream Model (Plot outlet tree + soil surface conditions) Topmodel (DEM + hydrological assumptions) Coupling water and pollutant (here pesticides), crop growth model Simple bio-physical models or expert rules
Map of the surface areas where the water table depth < threshold (1 m) at two dates = Contributing areas by subsurface flow (preferential recharge to the shallow groundwater)
Map of surface areas with soil sealing (soil surface conditions changing in time) = the potential contributing area related to surface runoff These surface areas increase in time
Map of surface areas connected and disconnected to the stream Surface runoff can infiltrate on a part of the previous identified plots = the effective contributing areas related to surface runoff
4. Deduce expert rules and spatial patterns explaining pollutant fluxes Trepos R., phD Trepos R, Salleb A et al., 2005. A distance approach for action recommandation. In : Machine Learning : ECML 2005 - Proceedings. Gama, J.;Camacho, R;Brazdil, P.;Jorge, A.;Torgo, L.(Eds). 16th European Conference on Machine Learning. 3-7 Oct. 2005, Porto, PT. Vol. 3720 p.425-436http://dx.doi.org/10.1007/11564096_41
Elaborate a large set of examples (simulations) Induce rules (attributes or spatial patterns)
Surface =0. 9ha Surface = 0.3ha Surface = 1ha Corn = true Corn = true Corn = false Peticide applied = 18g Peticide applied = 15g Large set of simulation results on plot outlet Surface = 0.4ha Surface = 0.9ha trees are used for Corn = false Corn = false induction processes Surface = 0.4ha Corn = true Peticide applied = 25g Method 2 : the information Method 1 : tree patterns are contained in the trees are generated, based on synthesized and attribute - value inductive logic programming rules identified. 7 attributes per plot 11 global attributes per tree Automatic learning Total amount of pesticides per plot Total amount of pesticides Contributing area of the outlet % of 2 types of chemical ( Koc and half time) Maize crop (true or false) % of pre - emergence applications Buffer zone (true or false) Total surface area of the tree Slope of the plot % of maize crop Topographic index (soil wetness) Surface of the largest maize plot Post or pre - emergence application % of buffer zone Tree - structure depth Elevation range of the tree structure Pattern of the tree structure (long / width) Surface > 0.8 ha If maize crop > 50% Limited set of AND Total quantity of pesticides > 55 g patterns and THEN high pesticides contamination Surface > 0.4 ha rules Maize = true Two automatic learning methods have been tested
To help the decision making process, the learning methods are incorporated in a visualization tool. Plot outlet trees are explained by selected patterns and rules on a catchment view Interactive selection of patterns and rules
proposition • Dynamique connectivité = Arbre de parcelle dynamique (pas journalier) • Occupation du sol : données • Etat de surface : règle (Pluie, date de W du sol) • Règle sacadeau – Sans le modèle. • Pluie : données • Utilisation de WPS : tester l’intérêt • Interrogation web • Corrélation • Surface connectée /pression relative journalière / flux
Intérêt / limites • Données et outils disponibles • Données riches • BV moyennement intéressant • Forme, échelle : connectivité très évolutive… • Importance sources « hors champs » • Stage de master SIG / info.
Conclusions Scale: test the interest at operational scale (50 km²) Method: dynamic method, analysing the evolution of plot connectivy in time A chain of tools for decision making in spatio-temporel processes - Here applied to erosion and pesticide contamination - Being developed for N (part 4) and P (all the 4 parts)