Fish Distribution
Fish Distribution and Factors affecting their structure and function


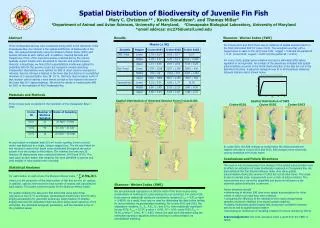
Fish Distribution
E N D
Presentation Transcript
Fish distribution and factors affecting their structure & function Janice C. Leriorato, Ph.D. Department of Biology College of Arts and Sciences Xavier University – Ateneo de Cagayan
Fish distribution, composition, and historical Fish distribution, composition, and historical biogeography by region biogeography by region • almost 60% (~58%) of fish are marine (Hart & Reynolds 1999) Figure credit: Rainer Froese, GEOMAR
Diversity in Large Diversity in Large Marine Ecosystems Marine Ecosystems • Marine species of fish • 13% pelagic • 1% epipelagic • 5% in unlighted zones of water - (deepwater pelagic) • 7% in bottom - -(deepwater benthic fish) • 78% in within 200m (coral reef and photic zone) Figure credit: Rainer Froese, GEOMAR
Environmental envelope Environmental envelope type modeling approach type modeling approach • • Half-degree resolution Based on preferences of species for temperature, depth, primary productivity, distance to land, and ice coverage (envelopes) Preferences are derived from databases such as FishBase, from occurrence data, and from experts Preferences are mapped on global distribution of environmental conditions Native ranges are enforced by bounding boxes • • • Slide credit: Rainer Froese, GEOMAR
Fish distribution, composition, and historical Fish distribution, composition, and historical biogeography by region biogeography by region • approximately 40% (41%, ~11,900 species) are freshwater (Hart & Reynolds 1999) Photo credit: Freshwater Aquamaps
Fish distribution, composition, and historical Fish distribution, composition, and historical biogeography by region biogeography by region • approximately 1% of fish (~290 species) are diadromous (Hart & Reynolds 1999) – Catadromous –spend most of life in freshwater and move to sea to spawn, e.g. freshwater eels (Anguillidae)
Fish distribution, composition, and historical Fish distribution, composition, and historical biogeography by region biogeography by region • approximately 1% of fish (~290 species) are diadromous (Hart & Reynolds 1999) – Anadromous- spend most of life in sea but move to freshwater to spawn, e.g. some carangids (talakitok such as maliputo of Taal Lake [Carangoides sexfasciatus]), Pacific salmon and trouts
Fish distribution, composition, and historical Fish distribution, composition, and historical biogeography by region biogeography by region • approximately 1% of fish (~290 species) are diadromous (Hart & Reynolds 1999) – Amphidromous- these are species that move from freshwater to marine water for other purpose other than spawning • FW move to MW as larvae to feed and grow then move back to FW as juvenile to adulthood e.g. Gobiidae, Eleotridae • Bangus (Chanos chanos is also an example) Fish Migration
Ocean Abiotic Factors Ocean Abiotic Factors Biotic Factors Biotic Factors • Temperature • Salinity • Nutrients (Primary productivity) • Oxygen • Solar energy • Water clarity • Tides • Substrate (habitat structure) • Aerial exposure • Currents • Predation • Competition
Biogeographic zones based on Biogeographic zones based on Sea Surface Temperature (SST) Sea Surface Temperature (SST) -> Climate Change Expanded Range Native Range
Latitudinal temperature profiles Latitudinal temperature profiles
Geographic Geographic distribution of salinity distribution of salinity
Salinity Variation Salinity Variation 1 1 3 2 2 3
Sea ice Sea ice
Seawater Seawater pressure pressure Solar energy Solar energy
Seasonal Seasonal Vertical migration Vertical migration Diel Diel
Reef Reef- -associated fish adaptations associated fish adaptations False eyes Camouflage
Oceanic (pelagic) fish adaptations Oceanic (pelagic) fish adaptations Fast swimmers Countershading
Mesopelagic fish adaptations Mesopelagic fish adaptations
References: • AquaMaps (www.aquamaps.org) • FishBase (www.fishbase.se/search) • Lee G., Strokes J. (eds.) 2006 - Marine Science_ An Illustrated Guide to Science