Download

1 / 58
580 likes | 758 Vues
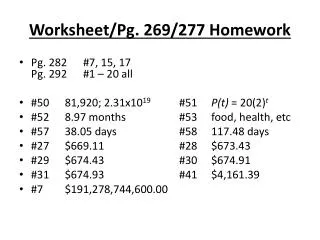
Review of Homework Worksheet. Please click in. Set your clicker to channel 41. My last name starts with a letter somewhere between A. A – D B. E – L C. M – R D. S – Z .

E N D
Please click in Set your clicker to channel 41 My last name starts with a letter somewhere between A. A – D B. E – L C. M – R D. S – Z
Introduction to Statistics for the Social SciencesSBS200, COMM200, GEOG200, PA200, POL200, SOC200Lecture Section 001, Fall, 2011Room 201 Physics-Atmospheric Sciences (PAS)10:00 - 10:50 Mondays & Wednesdays + Lab Session Welcome http://www.youtube.com/watch?v=oSQJP40PcGI
Use this as your study guide By the end of lecture today9/26/11 Measures of variability Standard deviation and Variance Counting ‘standard deviationses’ – z scores Connecting raw scores, z scores and probabilityConnecting probability, proportion and area of curve Percentiles
Homework due - (September 28th) On class website: please print and complete homework worksheet #5 Please double check – Allcell phones other electronic devices are turned off and stowed away
Please read: Chapters 5 - 9 in Lind book & Chapters 10, 11, 12 & 14 in Plous book: Lind Chapter 5: Survey of Probability Concepts Chapter 6: Discrete Probability Distributions Chapter 7: Continuous Probability Distributions Chapter 8: Sampling Methods and CLT Chapter 9: Estimation and Confidence Interval Plous Chapter 10: The Representativeness Heuristic Chapter 11: The Availability Heuristic Chapter 12: Probability and Risk Chapter 14: The Perception of Randomness We’ll be jumping around some…we will start with chapter 7
Standard deviation: The average amount by which observations deviate on either side of their mean Deviation scores Diallo is 0” Preston is 2” Mike is -4” Hunter is -2 Shea is 4 David is 0” Remember, it’s relative to the mean Generally, (on average) how far away is each score from the mean? Based on difference from the mean Mean Diallo Please memorize these Preston Shea Mike
Scores, standard deviations, and probabilities Mean = 50 S = 10 (Note S = standard deviation)
Scores, standard deviations, and probabilities Mean = 50 S = 10 (Note S = standard deviation)
Scores, standard deviations, and probabilities Mean = 50 S = 10 (Note S = standard deviation)
Scores, standard deviations, and probabilities Mean = 50 S = 10 (Note S = standard deviation)
Scores, standard deviations, and probabilities Mean = 50 S = 10 (Note S = standard deviation) If we go up one standard deviation z score = +1.0 and raw score = 60 If we go down one standard deviation z score = -1.0 and raw score = 40
Scores, standard deviations, and probabilities Mean = 50 S = 10 (Note S = standard deviation) If we go up two standard deviations z score = +2.0 and raw score = 70 If we go down two standard deviations z score = -2.0 and raw score = 30
Scores, standard deviations, and probabilities Mean = 50 S = 10 (Note S = standard deviation) If we go up three standard deviations z score = +3.0 and raw score = 80 If we go down three standard deviations z score = -3.0 and raw score = 20
Scores, standard deviations, and probabilities What if we go up 2.0 standard deviations? Then, z score = +2.0
Scores, standard deviations, and probabilities What if we go up 2.5 standard deviations? Then, z score = +2.5
Scores, standard deviations, and probabilities What if we go down 1.26 standard deviations? Then, z score = -1.26
z scores z score: A score that indicates how many standard deviations an observation is above or below the mean of the distribution z score = raw score - mean standard deviation What’s the biggest possible z score? How are standard deviations (or z scores) related to probability (also known as area under the curve or proportion of curve or percent of curve)
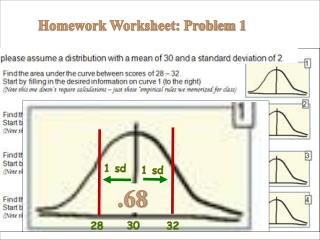
The Empirical Rule for “normal curve” Probability / proportion / percent / area under the curve Mean = 50 S = 10 (Note S = standard deviation)
Scores, standard deviations, and probabilities 68% 34% 34% Mean = 50 S = 10 (Note S = standard deviation) If we go up one standard deviation z score = +1.0 and raw score = 60 If we go down one standard deviation z score = -1.0 and raw score = 40
The Empirical Rule for “normal curve” Probability / proportion / percent / area under the curve Mean = 50 S = 10 (Note S = standard deviation)
Scores Probability (also percent Distance from mean or proportion (z scores) or area) Scores, standard deviations, and probabilities 95% 47.5% 47.5% Mean = 50 S = 10 (Note S = standard deviation) If we go up two standard deviations z score = +2.0 and raw score = 70 If we go down two standard deviations z score = -2.0 and raw score = 30
The Empirical Rule for “normal curve” Probability / proportion / percent / area under the curve Mean = 50 S = 10 (Note S = standard deviation)
Scores Probability (also percent Distance from mean or proportion (z scores) or area) Scores, standard deviations, and probabilities 99.7% 49.85 49.85 Mean = 50 S = 10 (Note S = standard deviation) If we go up three standard deviations z score = +3.0 and raw score = 80 If we go down three standard deviations z score = -3.0 and raw score = 20
2 sd above and below mean 95% 1 sd above and below mean 68% 3 sd above and below mean 99.7% This will be so helpful now that we know these by heart
Raw scores, z scores & probabilities 1 sd above and below mean 68% z = +1 z = -1 Mean = 50 S = 10 (Note S = standard deviation) If we go up one standard deviation z score = +1.0 and raw score = 60 If we go down one standard deviation z score = -1.0 and raw score = 40
Raw scores, z scores & probabilities 2 sd above and below mean 95% z = -2 z = +2 Mean = 50 S = 10 (Note S = standard deviation) If we go up two standard deviations z score = +2.0 and raw score = 70 If we go down two standard deviations z score = -2.0 and raw score = 30
Raw scores, z scores & probabilities 3 sd above and below mean 99.7% z = +3 z = -3 Mean = 50 S = 10 (Note S = standard deviation) If we go up three standard deviations z score = +3.0 and raw score = 80 If we go down three standard deviations z score = -3.0 and raw score = 20
Scores, standard deviations, and probabilities Actually 68.26 Actually 95.44 To be exactly 95% we will use z = 1.96
Raw scores, z scores & probabilities The normal curve is defined mostly by its mean, and standard deviation. Once we know that we can figure out a lot z-table (from z to area) Distance from the mean ( from raw to z scores) Raw Scores (actual data) Proportion of curve (area from mean) Given any of these values (score, probability of occurrence, or distance from the mean) and you can figure out the other two.
Scores, standard deviations, and probabilities What is total percent under curve? What proportion of curve is above the mean? .50 100% Given any of these values (score, probability of occurrence, or distance from the mean) and you can figure out the other two.
Scores, standard deviations, and probabilities What score is associated with 50th percentile? What percent of curve is below a score of 50? 50% mean Mean = 50 S = 10 (Note S = standard deviation)
Raw scores, z scores & probabilities Distance from the mean (z scores) convert convert Proportion of curve (area from mean) Raw Scores (actual data) We care about this! What is the actual number on this scale?“height” vs “weight” “pounds” vs “test score” We care about this! “percentiles” “percent of people” “proportion of curve” “relative position” Proportion of curve (area from mean) Raw Scores (actual data) Distance from the mean (z scores) convert convert
1 sd above and below mean 68% Raw scores, z scores & probabilities z = +1 z-table (from z to area) Distance from the mean ( from raw to z scores) If we go up to score of 60 we are going up 1.0 standard deviation z = -1 Then, z score = +1.0 Raw Scores (actual data) Proportion of curve (area from mean) z score = 60 – 50 10 10 10 = 1 = Mean = 50 Standard deviation = 10 If we go down to score of 40 we are going down 1.0 standard deviation Then, z score = - 1.0 z score = 40 – 50 10 -10 10 = -1 = z score = raw score – mean standard deviation
2 sd above and below mean 95% Raw scores, z scores & probabilities z = +2 z-table (from z to area) Distance from the mean ( from raw to z scores) z = -2 If we go up to score of 70 we are going up 2.0 standard deviations Then, z score = +2.0 Raw Scores (actual data) Proportion of curve (area from mean) z score = 70 – 50 10 20 10 = 2 = Mean = 50 Standard deviation = 10 If we go down to score of 30 we are going down 2.0 standard deviations Then, z score = - 2.0 z score = 30 – 50 10 -20 10 = -2 = z score = raw score – mean standard deviation
3 sd above and below mean 99.7% Raw scores, z scores & probabilities z = +3 z = -3 z-table (from z to area) Distance from the mean ( from raw to z scores) If we go up to score of 80 we are going up 3.0 standard deviations Then, z score = +3.0 Raw Scores (actual data) Proportion of curve (area from mean) z score = 80 – 50 10 30 10 = 3 = Mean = 50 Standard deviation = 10 If we go down to score of 20 we are going down 3.0 standard deviations Then, z score = - 3.0 z score = 20 – 50 10 -30 10 = -3 = z score = raw score – mean standard deviation
Mean = 50 sd = 10 50 60 68% We’re going to want to talk probabilities (area under the curve) for pairs of scores 34% 34% Find the area under the curve that falls between 50 and 60 z-table (from z to area) Distance from the mean ( from raw to z scores) Raw Scores (actual data) Proportion of curve (area from mean) 1) Draw the picture 2) Find z score z score = raw score - mean standard deviation 60 - 50 10 +1.0 = 3) Go to z table - find area under correct column 4) Report the area Hint always draw a picture!
50 60 1) Draw the picture 2) Find z score .3413 3) Go to z table - find area under correct column 4) Report the area Page 514 Find the area under the curve that falls between 50 and 60 60 - 50 10 +1.0 = z score of 1 = area of .3413 Are we done? Yes
Mean = 50 sd = 10 40 50 50 60 68% We’re going to want to talk probabilities (area under the curve) for pairs of scores 34% 34% Find the area under the curve that falls between 40 and 60 z-table (from z to area) Distance from the mean ( from raw to z scores) Raw Scores (actual data) Proportion of curve (area from mean) 1) Draw the picture 2) Find two z scores z score = raw score - mean standard deviation 60 - 50 10 40 - 50 10 +1.0 -1.0 = = 3) Go to z table - find area under correct column 4) Report the area Hint always draw a picture!
40 50 50 60 1) Draw the picture .6826 2) Find z score 3) Go to z table - find area under correct column .3413 .3413 4) Report the area Page 514 Find the area under the curve that falls between 40 and 60 40 - 50 10 -1.0 = z score of -1 = area of .3413 60 - 50 10 +1.0 = z score of 1 = area of .3413 Not Yet Now, we’re done Are we done? .3413 +.3413 = .6826
Ties together z score with Draw picture of what you are looking for... Find z score (using formula)... Look up proportions on table...(Appendix B – page 514) • probability • proportion • percent • area under the curve 68% 34% 34%
Mean = 50 sd = 10 We’re going to want to talk probabilities (area under the curve) for pairs of scores 30 40 50 Find the area under the curve that falls between 30 and 50 z-table (from z to area) Distance from the mean ( from raw to z scores) 1) Draw the picture Raw Scores (actual data) Proportion of curve (area from mean) 30 40 50 2) Find z score z score = raw score - mean standard deviation 30 - 50 10 - 2.0 = 3) Go to z table - find area under correct column 4) Report the area Hint always draw a picture!
Mean = 50 sd = 10 1) Draw the picture 2) Find z score .4772 3) Go to z table - find area under correct column 4) Report the area 30 40 50 Page 514 Find the area under the curve that falls between 30 and 50 30 - 50 10 -2.0 = z score of -2 = area of .4772 Are we done? Yes
50 75 50 75 We’re going to want to talk probabilities (area under the curve) for pairs of scores ? Find the area under the curve that falls between 50 and 75 z-table (from z to area) Distance from the mean ( from raw to z scores) Raw Scores (actual data) Proportion of curve (area from mean) 1) Draw the picture 2) Find z score z score = raw score - mean standard deviation 75 - 50 10 +2.5 = 3) Go to z table - find area under correct column 4) Report the area Hint always draw a picture!
50 75 1) Draw the picture 2) Find z score .4938 3) Go to z table - find area under correct column 4) Report the area Page 514 Find the area under the curve that falls between 50 and 75 75 - 50 10 +2.5 = z score of 2.5 = area of .4938 Are we done? Yes
50 75 50 75 Mean = 50 sd = 10 We’re going to want to talk probabilities (area under the curve) for pairs of scores ? Find the area under the curve that falls below a score of 75 z-table (from z to area) Distance from the mean ( from raw to z scores) Raw Scores (actual data) Proportion of curve (area from mean) 1) Draw the picture 2) Find z score z score = raw score - mean standard deviation 75 - 50 10 +2.5 = 3) Go to z table - find area under correct column 4) Report the area Hint always draw a picture!
50 75 Mean = 50 sd = 10 .4938 1) Draw the picture 2) Find z score .9938 3) Go to z table - find area under correct column 4) Report the area Page 514 Find the area under the curve that falls below a score of 75 75 - 50 10 +2.5 = z score of 2.5 = area of .4938 This is the same thing as “Please find the percentile for a score of 75”. Are we done? No Now, we’re done .4938 +.5000 = .9938
50 55 50 55 Mean = 50 sd = 10 We’re going to want to talk probabilities (area under the curve) for pairs of scores ? Please find the percentile rank for a score of 55 z-table (from z to area) Distance from the mean ( from raw to z scores) Raw Scores (actual data) Proportion of curve (area from mean) 1) Draw the picture 2) Find z score z score = raw score - mean standard deviation 55 - 50 10 +0.5 = 3) Go to z table - find area under correct column 4) Report the area Hint always draw a picture!
50 55 Mean = 50 sd = 10 .1915 1) Draw the picture 2) Find z score .6915 3) Go to z table - find area under correct column 4) Report the area Page 514 Please find the percentile rank for a score of 55 55 - 50 10 +0.5 = z score of 0.5 = area of .1915 Are we done? No Now, we’re done .1915 +.5000 = .6915
45 45 Mean = 50 sd = 10 ? We’re going to want to talk probabilities (area under the curve) for pairs of scores Please find the percentile rank for a score of 45 z-table (from z to area) Distance from the mean ( from raw to z scores) ? Raw Scores (actual data) Proportion of curve (area from mean) 1) Draw the picture 2) Find z score z score = raw score - mean standard deviation 45 - 50 10 -0.5 = 3) Go to z table - find area under correct column 4) Report the area Hint always draw a picture!