Download

1 / 37
380 likes | 481 Vues
Explore the use of latent variable models in Biostatistics through the ADAPT trial example, modeling heterogeneity, and the comparison of mixed effects vs. growth mixture models. Understand the implications of NSAID use in Alzheimer's disease treatment and prevention trials.

E N D
Growth Mixture Model Latent Variable Modeling and Measurement Biostatistics Program Harvard Catalyst | The Harvard Clinical & Translational Science Center Short course, October 28, 2016 Slides contributed by Jeannie-Marie Leoutsakos, Assistant Professor of Psychiatry & Mental Health, Johns Hopkins University
Outline • Motivating Example: The ADAPT trial • Two Options for Modeling Heterogeneity 1. Mixed Effects/Growth Curve Models 2. Growth Mixture Models • Comparison of Options & Final Thoughts
AD and Inflammation • AD characterized by β-amyloid plaques and neurofibrillary tangles • AD is progressive, with a long pre-clinical period. • Inflammatory processes have been linked to plaque and tangle formation • Inflammatory processes also linked to clearance of β-amyloid.
AD and NSAIDs • In observational studies, NSAID use associated with reduced risk of AD • AD treatment trials show no effect of NSAIDs • In an MCI prevention trial, NSAID increased risk.
The ADAPT Trial • Multi-site prevention trial N=2528 • Participants 70+, family history of AD • 200 mg of celecoxib bid, 220 mg of naproxen sodium bid, or matching placebo (1:1:1.5) • Enrollment began in 2001, halted December 2004 due to safety concerns. • Study cohort is still being followed.
Option 1. LGCM i indexes individuals j indexes timepoints Each individual i has her own personal intercept η0i and personal slope η1i
Option 1. Mixed Effects Model β1tij +β5nap·tij β0+b0i β0 β1tij+b1itij β1tij 3MS β1tij + β3cel·tij time Yij=00+ 10tij+b1iti + 12cel·tij+ 13nap·tij+εij Yij=00+0i+ 10tij+1itij+ 12cel·tij+ 13nap·tij+εij
SAS Syntax • Random Intercept + Random Slope Model procmixed data = adapt method=ml covtest; model h=time agec drug1 drug2 time*drug1 time*drug2 /s; random int time/ type = un sub = id; run; Model Random Effects
Mixed Effects with Quadratic Term β1tij +β5nap·tij+ β8nap·tij2 β0+β4 β0+b0i β1tij+b1itij+β6tij2 β0 β0+β2 β1tij+ β6tij2 3MS β1tij + β3cel·tij+ β7cel·tij2 time Yij=β0+b0i+ β1tij+b1itij+β2cel+ β3cel·tij+ β4nap+ β5nap·tij+ β6tij2+ β7cel·tij2+ β8nap·tij2+ εij
Observed and Predicted Trajectories Model I Model II
Rates of Decline in Pre-Clinical AD • Prior to clinical dx, decline rate not constant • Can consider trajectories as being in “classes”: no, slow, & fast decline.
The Timing Hypothesis • Contradiction between observational and clinical trials due to differences in timing of exposure to NSAIDs • Early/little or no decline: NSAIDs good • Later/ substantial decline: NSAIDs bad • Observational trials: most individuals in no/slow decline class when exposed • Clinical trials: larger proportion of individuals in the fast decline class
Testing the Timing Hypothesis • Ideal: Stratify individuals by decline class, fit mixed effects models with NSAID effects separately for each class. • Problem: we don’t know for sure how many classes there are, or who is in each class. Class is a latent variable.
Mixed Effects Models as “Growth Models” • Term used in developmental research • “Growth” – getting taller, smarter, etc. • Fixed effects (intercept, slope, quadratic) referred to as “Growth Factors”
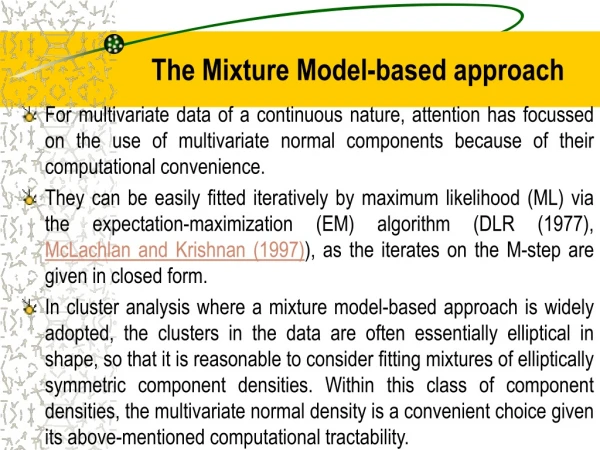
Mixture Models • Useful when you believe your population is actually a mixture of subpopulations. • “Mixture” here has nothing to do with “Mixed Effects”
Option 2. Growth Mixture Models • Allows for the estimation of a pre-specified number of latent classes of trajectories • Determined via a combination of substantive theory, fit indices, and bootstrapped likelihood ratio tests. • Estimates mixed effects model (growth model) parameters for each latent class
Option 2. LGMM i indexes individuals j indexes timepoints K indexes latent classes Each class k has its own class-specific intercept η0k and slope η1k, and class-specific drug-effects
Growth Mixture Model Parameters • For each class (indexed by k), we now have • Simultaneously, model probability of membership in each class via multinomial logistic regression - this allows for inclusion of predictors of class membership (e.g., age, such that older individuals have greater probability of membership in the fast-decline class. Yij=0k+0i+ 10ktij+1itij+ 11kcel·tij+ 12knap·tij+εij
Step 1. for LGMM Single-class LGCM (no covariates) • Assess variability of intercepts and slopes (graphically) • Determine whether a quadratic term is needed. • Assess the correlation structure among outcomes across time. (eg, is it OK to hold residual variance of Ys constant over time?).
Step 2. For LGMM Fit Latent Class Growth Analyses • Unlike GMM, var(I) and var(S) is fixed at 0. • Using the same methods as with LCA (BIC and BLRT) determine the appropriate number of classes • Do this with and without covariates
MPLUS Input for LCGA Specify latent classes Fix I and S variances Estimate I and S separately for each class
MPLUS Input for BLRT one set of start values for parameter estimation Specify # of starts for BLRT Ask for BLRT
Choosing Number of Classes Without covariates (and with, not shown) a two-class model does not fit the data as well as a three-class model
Step 3. Fit GMM • First with class invariant I, S variances • Also possible to have class-varying I,S variances • Add covariates • Ponder meaning
Adding Covariates • Age as a predictor of class membership • Drug1 and Drug 2 modify class-specific* slopes.
Expected Change Over Time A model where drug effects are forced to be the same across classes fits the data significantly worse (-2LLD: 369.23; p<0.001)
Mixed Effects Assumes one population Simpler interpretation More parsimonious Standard software Results can be more definitive Growth Mixture Model Models subpopulations Complex interpretation More parameters Need larger sample Need $pecial $oftware Results not definitive; post-hoc subgroup analysis Comparison of Options
Final Thoughts on Growth Mixture Models • What does it all mean? • possible to get fit indices, etc which support a multi-class mixture when really there are no underlying subgroups. • Entails a number of assumptions about the within-person correlation and random effects, results can be highly sensitive to those assumptions • Assumptions/model fit difficult to check • Hypothesis generating/refining rather than confirming.